While geopolitical events have dominated the news flow in recent weeks, discontent regarding the affordability issue – which has been on top of Americans’ minds since the 2024 election – is still brewing under the surface. The rapid deployment of AI, which is exacerbating income inequalities and is diminishing the career prospects of young white-collar workers, makes finding solutions to this issue even more pressing. While there are no easy answers, voters certainly expect their government to develop credible action plans and to communicate about progress made. The administration won’t be able to carry out its agenda of making America great if it gets a serious rebuke at the midterms. Historically, the state of the economy has been a good predictor of election outcomes and since recent economic data suggest that economic growth is robust and that inflation is mild, the Republicans’ prospects should look good in theory. However, concerns about affordability are throwing a monkey wrench into that prediction, since they reveal perceptions that the economy is working only for a small minority of higher income/wealthier households. As of early February, according to prediction markets, the House is pretty much a lock for the Democrats and even the Senate could be in play. However, 9 months are an eternity in politics, so public opinion could shift materially in the meantime.
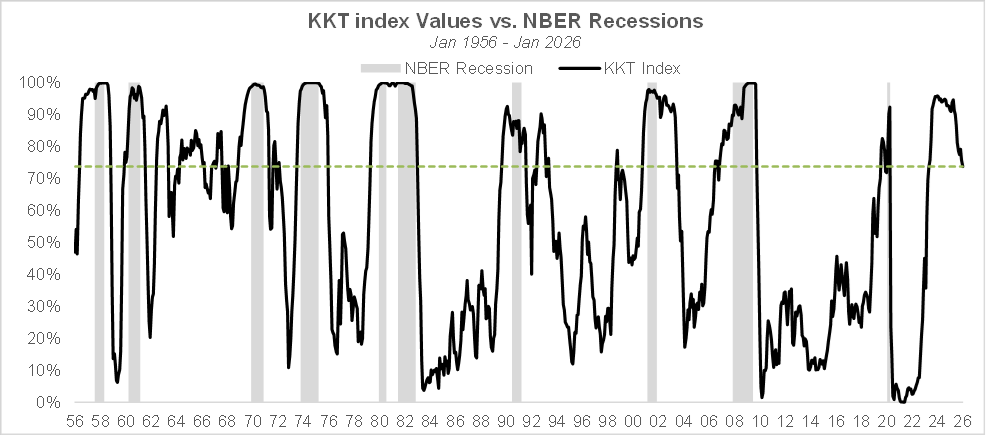
As of the end of January, the KKT index has declined to 73.4%, a reading that is consistent with the US economy being away from recession territory, an assessment that is confirmed by the Q2 and Q3 GDP prints along with the +4.2% estimate by GDPNow for Q4. The recent readings of the manufacturing and services PMIs are consistent with that assessment. However, the employment situation remains weak, as the latest ADP report illustrates, and consumer sentiment remains depressed.
The robust GDP growth observed in recent quarters, which is expected to continue over the next few quarters because of the stimulative measures adopted in the Big Beautiful Bill and of the lagged impact of the Fed’s rate cuts, raises concerns that inflation could be accelerating in the coming months. After telegraphing well in advance that the upcoming Fed chair would be a dove, Trump seems to have had an about face and eventually chose Kevin Warsh, who is -supposedly- leaning towards a hawkish monetary policy stance, perhaps out of concern that inflation could be accelerating alongside economic growth.
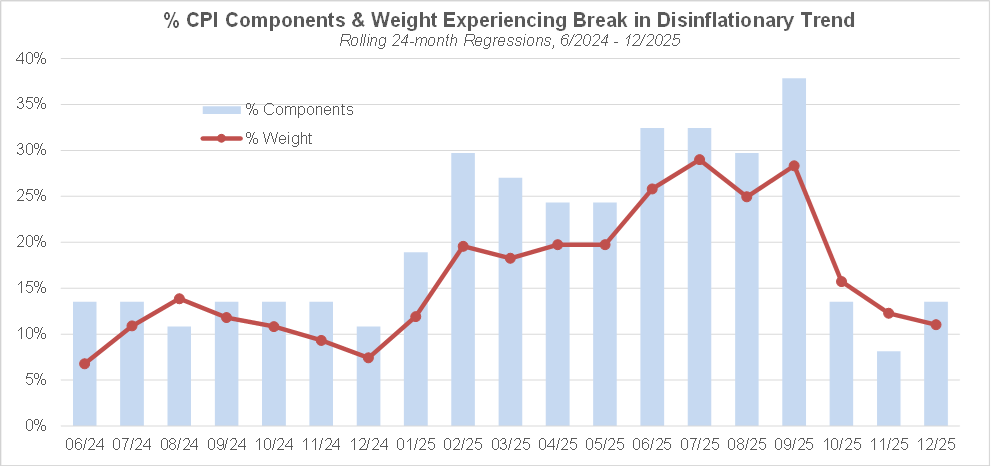
A few months ago, I introduced a piece of analysis that aims to quantify the breadth of CPI components that are experiencing a statistically significant upward inflection in their price trajectory since overall inflation started decelerating in the summer of 2022. A closer look at the breadth of components may be able to reveal some manifestations of inflation acceleration that may not be visible in the headline number. As shown below, while the breadth of components experiencing an upward inflection has been on a rising trend from 6/2024 to 9/2025, the latest (December) data suggest the trend has been broken, providing some confirmation that inflation is not on the cusp of accelerating for now.
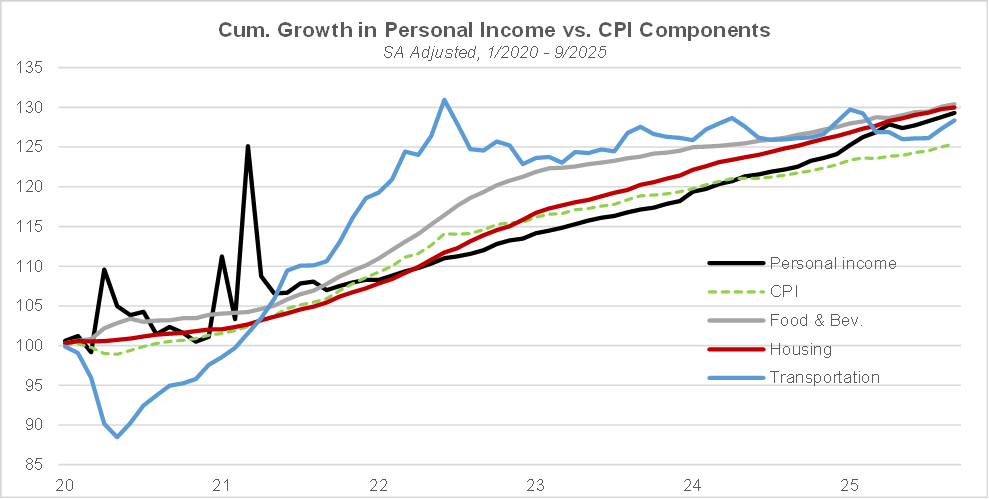
Given the strong recent GDP growth and relatively tame inflation, what could be the source of the sour social mood and poor readings on consumer sentiment indicators that we currently observe? Besides the long-standing matter of income inequalities, which have been widening since the GFC, the main source of discontent is affordability, or lack thereof. While economists typically focus on the inflation rate, i.e. the rate of change in prices of consumer goods and services, consumers are more concerned about whether increases in their incomes keep up with inflation. If inflation reaches the 2% target but wages don’t increase at all, goods and services become less affordable for consumers. Conversely, if the inflation rate is 10%, but wage growth is also 10%, complaints about affordability are unlikely to be very loud. The chart below shows the cumulative growth in personal income (which includes not just wages but also transfer payments, interest income, etc.) and in the CPI and some of its key components: housing, food & beverages, transportation, from 12/2019 to 9/2025 (i.e. before the government shutdown distorted official data). Over the period, income growth has more than kept up with inflation – assuming that changes in the CPI are, on average, an accurate reflection of changes in the cost of living, which is debatable. However, the housing and food & beverages components have increased at a faster rate than personal income. Not to mention that the housing component essentially consists of rent and owners’ equivalent rent. Over the period, the Case Shiller index has increased by 55%, far outpacing the 29% increase in income and making the quintessential American Dream that is home ownership out of reach for many members of the Gen Z and Millennial generations. After initially ignoring or minimizing the problem, the Trump administration has started to scramble for solutions late last year. So far, it has not offered much in the way of concrete measures to address the issue and may suffer the consequences in the midterms.
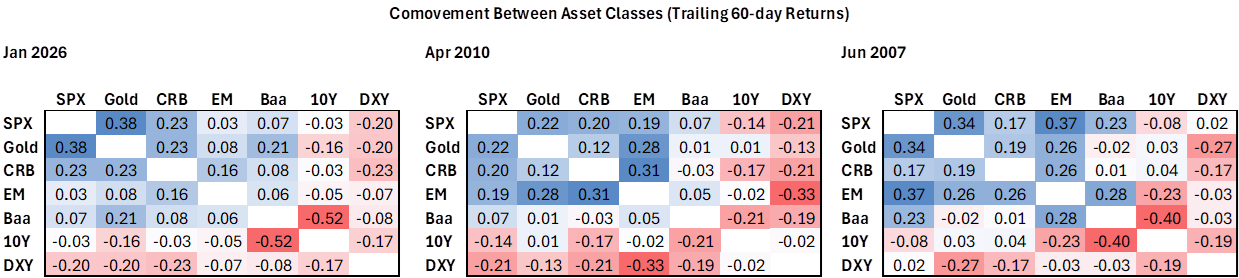
When looking at recent market action across various asset classes – stocks up, precious metals up, commodities up, emerging markets up, dollar down – the current macro regime is reminiscent of the post GFC environment in 2009/2010, consistent with the US economy being in an early cycle phase. A comparison of current cross asset correlations versus what they were at various points in history can help identify which periods of time were most comparable to the current macro regime and help confirm this intuition. The chart below is based on 7 data series, dating back to 1988 and representing various asset classes: the CRB Commodity index, the S&P 500® index, the gold spot price, the MSCI Emerging Markets index, the Baa credit spread, the 10-year Treasury yield and the dollar index (DXY). At each point in time, I calculated the co-movement matrix (i.e. correlations are calculated based on the signs of daily changes rather than based on the changes themselves) of those 7 data series based on trailing 3-month daily data. The L2 distance (the same Euclidian distance we use in everyday life) between the co-movement matrix at a given time T and that as of 1/30/2026 represents how close current cross asset correlations are from those at time T. As shown below, current cross asset correlations are the most similar with those as of April 2010 and as of June 2007.
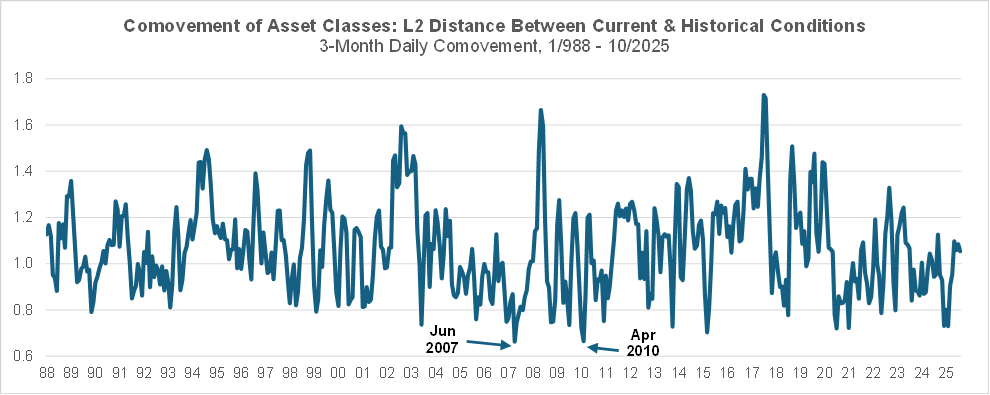
Those 3 moments in time (January 2026, April 2010, June 2007), correspond to periods when risk assets (US/EM equities, corporate bonds, commodities, precious metals) were positively correlated with one another while the dollar index was negatively correlated with those risk assets. Assuming that a significant financial crisis is not on the near horizon, April 2010 would be the closest analog to the current environment.
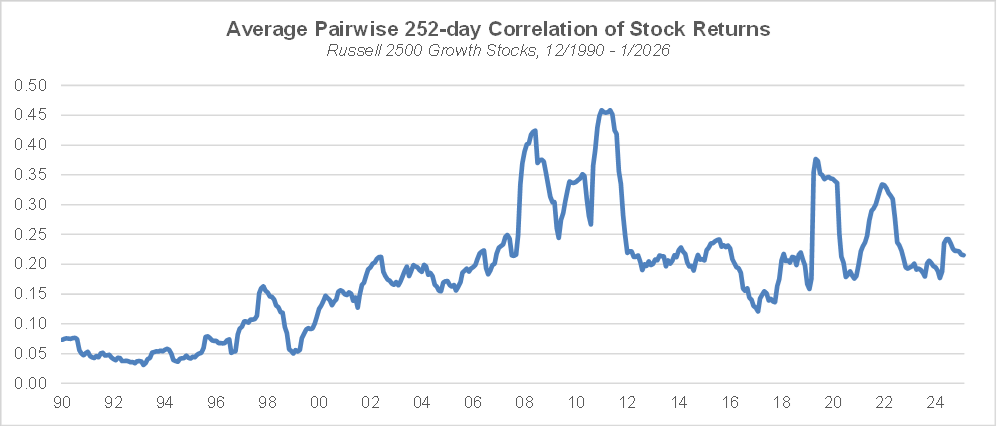
The long-term measure of sentiment we follow, the average pairwise correlation of stock returns, at 0.215 remains near the median historical values since the GFC and nowhere close to the 0.158 level reached in 1/2020, much less the 0.05 low from 12/1999, suggesting that investors’ risk seeking sentiment is not that extreme.
Besides, in the small and mid-cap growth universe, valuations – which, at the aggregate level are also a measure of sentiment – are still far from the extremes reached by a handful of mega caps: as shown below, the median price-to-sales in that space is broadly consistent (albeit at the upper end of the range) with the level of the 10-year Treasury yield, and is nowhere near the extremes reached in 6/2000 and 4/2021.
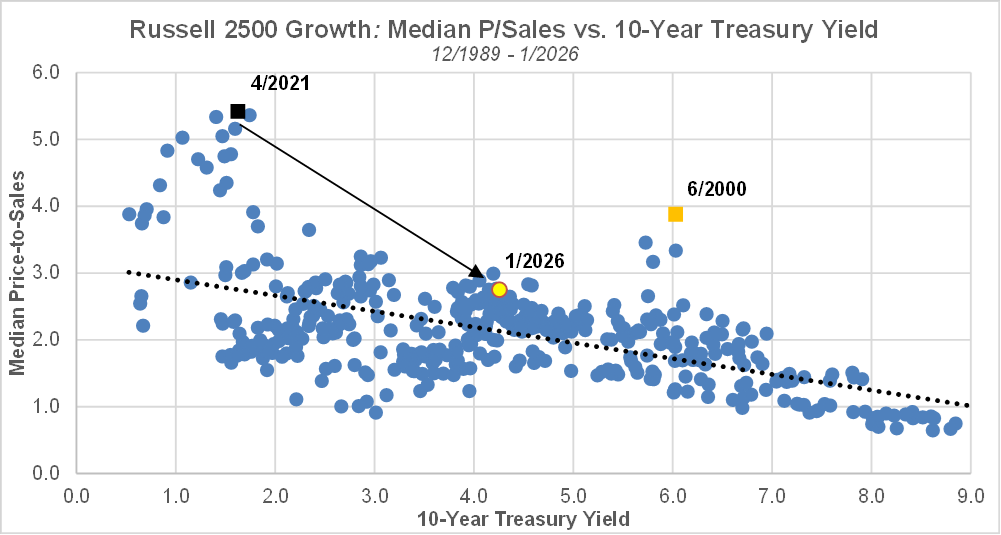
Source: FactSet, SIMG Analysis
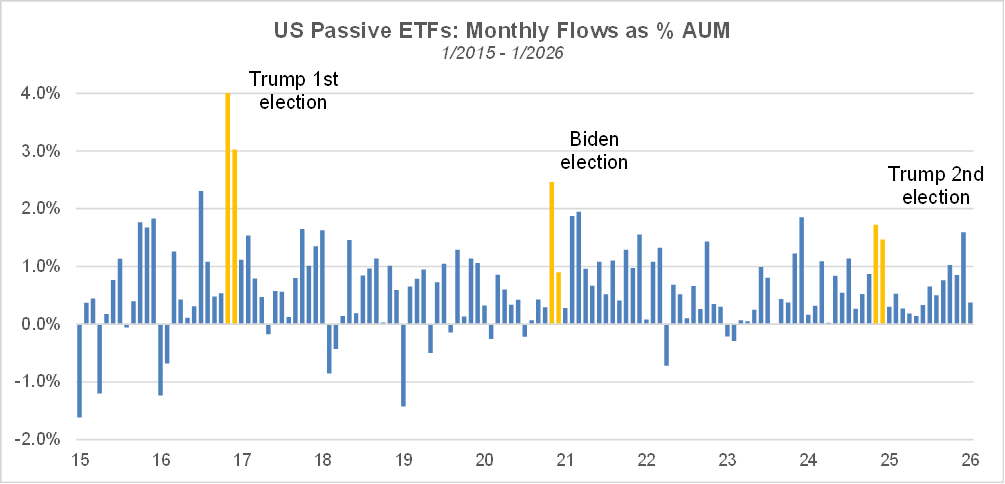
In addition, passive ETFs, which provide price insensitive demand for equities, have continued to see robust inflows in January.
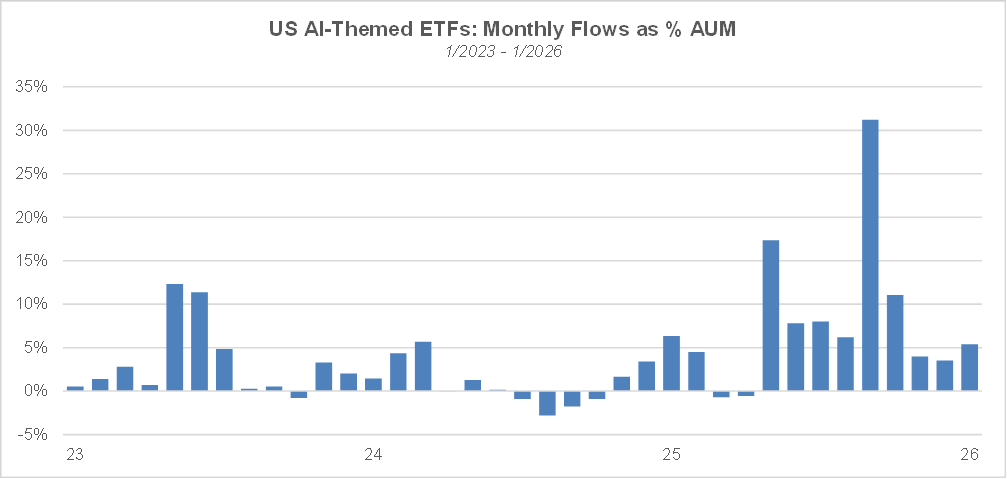
Furthermore, despite investors’ concerns that the AI theme may be in a bubble and that the recent growth rate in AI capex may not be sustainable, AI ETFs have continued to experience robust inflows. If indeed AI is in a bubble, calling for an imminent burst would certainly be premature. Bubbles can last longer than anyone expects – during the previous tech bubble, Alan Greespan uttered the famous “irrational exuberance” phrase in December 1996, more than 3 years before the peak, especially when they are government-sponsored.
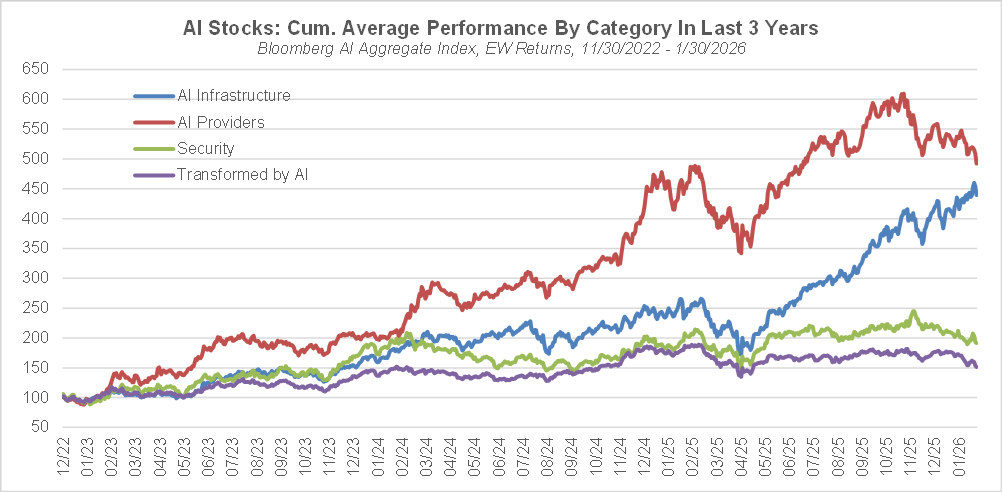
While AI ETFs have continued to receive robust inflows, there seems to have been some rotation occurring between sub segments within the theme. The chart below shows the cumulative performance since the end of November 2022 – when ChatGPT was released – of sub segments of the Bloomberg Artificial Intelligence index stocks that have a US listing. The AI universe has been divided into AI Providers (companies that develop AI models), AI infrastructure (companies that provide and help maintain the physical infrastructure necessary for the deployment of AI), AI security (companies providing cyber security solutions in the face of challenges posed by AI) and companies transformed by AI, which are non-AI companies using AI to improve their business. To avoid potential biases and keep the analysis systematic, I asked ChatGPT to classify each of the companies in the index.
While AI providers have led the pack until the end of October 2025, they have experienced a nearly 20% decline since then. At the same time, AI infrastructure stocks have continued their upward march despite concerns about future growth in AI capex. Meanwhile, the companies transformed by AI, which had been lagging since the beginning, have also experienced declines since last October, in a sign that investors are starting to ask for evidence that the massive investments in AI are delivering tangible results. As for the providers, their focus seems to have shifted in the past few months from the research and development of new models with capabilities ever closer to artificial general intelligence (the rhetoric about reaching AGI has quieted notably) to the commercialization of the current generation of AI systems based on large language models, with cutting edge AI research moving to startups. The departure of Yann Lecun from Meta – who has been consistently arguing that LLMs were not the way towards AGI – is a case in point. Another sign of this shift from research to commercialization is the sudden shortage in high bandwidth memory (HBM), which is a more important component for performing inference (when an AI system generates an answer to a request) than for training a new AI model. The resulting price spike in HBM is pressuring the margins of consumer electronics companies (as Nintendo’s latest earnings report illustrates) and is even forcing Apple to prioritize the production of its premium iPhone models.
The most promising avenue for commercializing AI models lies in code generation. As an early AI adopter, I noticed long ago that AI chatbots were exceptionally good at generating computer code relative to their abilities at reasoning or writing human-like fictional stories, and I have been using them as coding assistants ever since. Two years ago, ChatGPT’s code was inefficient, contained easily fixable bugs, and its quality would break down relatively quickly. I have seen notable improvements over time, leading me to suspect that some software companies would get disrupted sooner than later. Since the end of October, software stocks have experienced large declines, as investors have become increasingly concerned about the disruptive impact of AI on those companies. A recent essay by the CEO of Anthropic, Dario Amodei, https://www.darioamodei.com/essay/the-adolescence-of-technology, lends credence to those concerns. While the essay (long, but well worth the read) is a more comprehensive analysis of the national security, political, social and economic risks posed by AI and what we can do to address them, the most concerning from investors’ perspective is what he says about the pace of improvement in AI’s coding skills (emphasis his):
For example, in the last 2 years, AI models went from barely being able to complete a single line of code, to writing all or almost all of the code for some people—including engineers at Anthropic. Soon, they may do the entire task of a software engineer end to end. It is hard for people to adapt to this pace of change, both to the changes in how a given job works and in the need to switch to new jobs. Even legendary programmers are increasingly describing themselves as “behind.”
Of course, the role of a software company is much more than just generating code. For example, ensuring product reliability and maintaining client relationships remains within the purview of humans, at least for the time being. Not to mention that those companies can use AI to their advantage. Rigorous fundamental analysis will likely be necessary to sort out winners from losers within the industry.
While the case for massive AI disruption of the software industry seems compelling, I am not so certain AI would have a similar impact on other industries. In the essay, Dario Amodei predicts that half of entry-level white-collar jobs could be displaced within 1-5 years, with blue collar jobs being not too far behind, but this assumes that we reach what he calls “powerful AI” – which seems like some form of AGI – within the next 2 years. For now, AI enabled robots are still far from human level abilities and reasoning models still make glaring mistakes. Whether the pace of improvement in those areas matches that in coding skills is far from evident. Will the bitter lesson (the idea that progress towards more intelligent AI systems is essentially a matter of getting more compute) scale all the way to AGI? While I can see current AI systems’ effectiveness in retrieving and applying existing human knowledge, I have serious doubts that the essence of human creation can be captured by optimizing a reward function, however complex it may be.
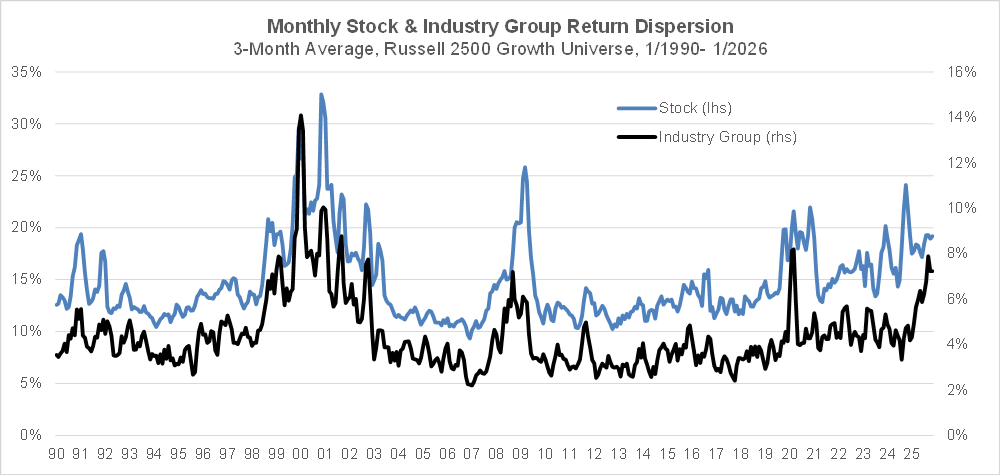
Over the last 13 years, the dispersion of monthly stock returns has been on a rising trend, with the latest 3-month average in the 86th percentile of history since 1990. Higher levels of dispersion have only been observed at times of significant macro stress, i.e. during the internet bubble burst, the GFC and the COVID pandemic. However, a more recent development (since Q4 2025) is the surge in the dispersion of industry returns, with the current 3-month average being in the 94th percentile vs. history. The current geopolitical context – which is boosting the returns to defense stocks – along with the disruptive impact of AI – which has caused substantial declines among software stocks – help explain this recent rise in industry return dispersion.
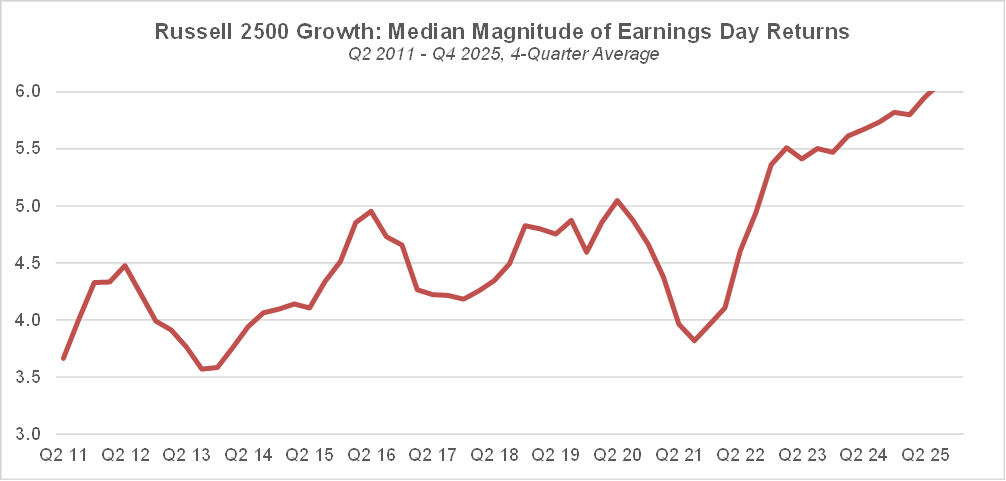
The trend in rising dispersion of stock and industry returns in the small & mid cap growth space is also consistent with the increasing magnitude of the median stock price response to earnings announcements that can be observed since 2011. With the increasing availability of real time big data sources and of AI solutions to help analysts derive insights from that mountain of data, one would think that investors’ ability to predict the financial performance of companies would have improved over time (resulting in a lower magnitude response to announcements), despite the overall decline in coverage by sell side analysts. Instead, instances of mispricing seem to have become ever more prevalent, thereby creating more opportunities for skilled investors.
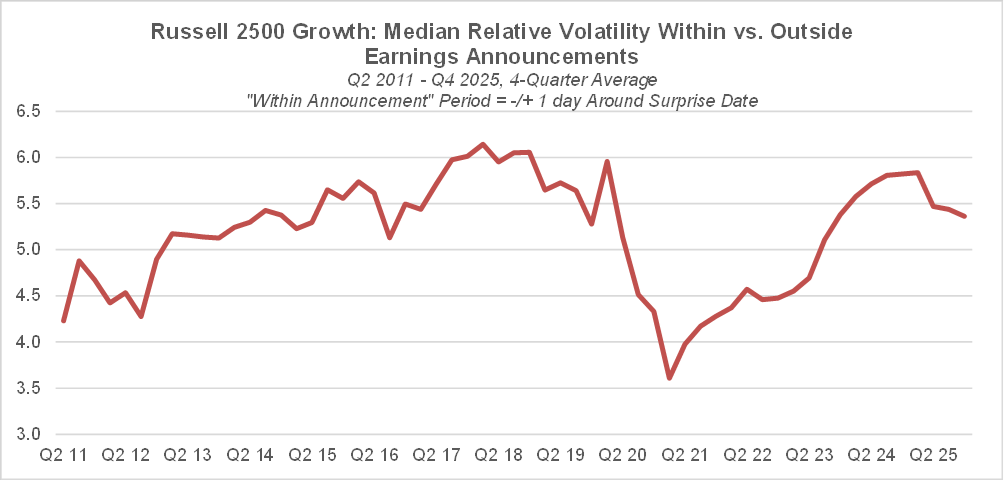
Besides the increasing gap between expectations and reported results (as revealed by the magnitude of stock return response to announcements), there also seems to be larger divergences of opinions among investors on how to respond to earnings announcements vs. 15 years ago. The chart below shows the median ratio of volatility during announcements (measured as the price range in the period from T-1 to T+1 where T is the surprise date, divided by the average close price over those 3 days) vs. volatility in the 60 days prior to T-1, measured using the standard deviation of daily returns. After a dip during COVID (when equity market volatility was high in general), the ratio has returned to its 2019 levels.
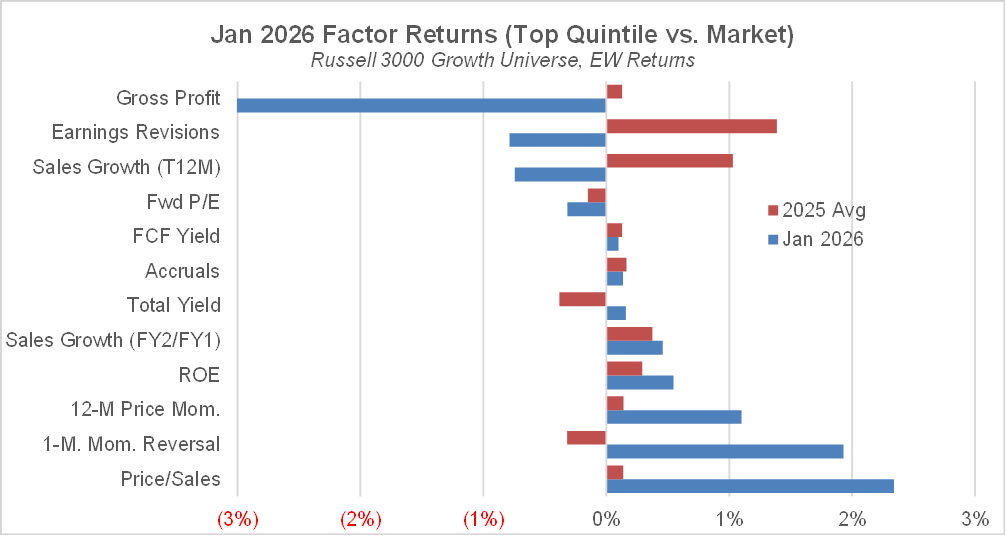
Within the factor space, the stocks that are typically favored within the growth universe (high gross profitability, strong revenue growth and robust estimates revisions) under-performed materially last month. By contrast, high momentum and attractively valued – in terms of price-to-sales – stocks have out-performed.
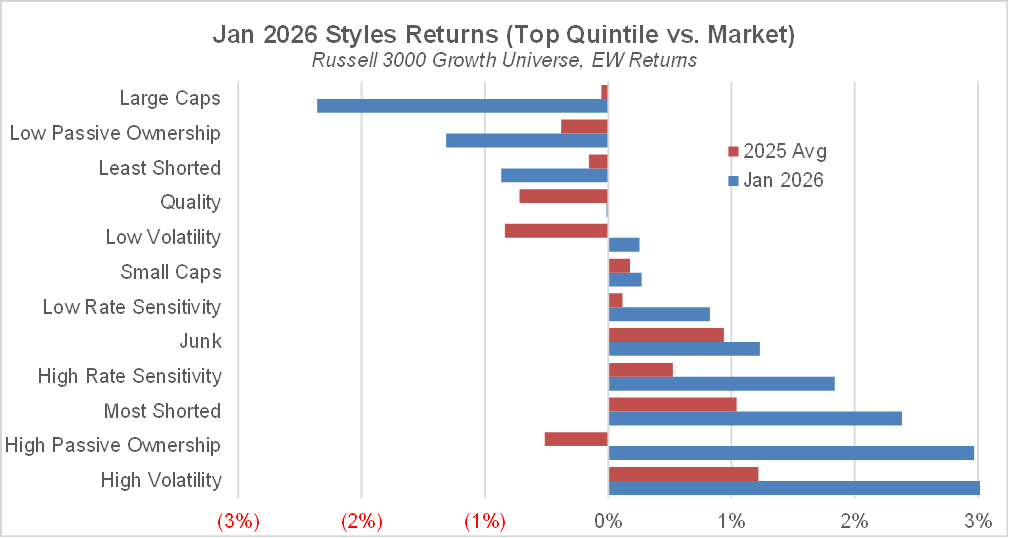
Regarding styles, January has seen a continuation of the risk-seeking sentiment that has prevailed most of the time since Liberation Day, as shown in the out-performance by high volatility, most-shorted, junk stocks. High rate sensitivity stocks (which tend to out-perform when long term rates rise) have also done well last month, along with high passive ownership stocks which continue to benefit from robust flows into passive funds and ETFs. Consistent with historical seasonal patterns, small cap stocks have outperformed while large caps have materially under-performed in January. It remains to be seen whether this is an indication of a longer lasting rotation towards small caps.
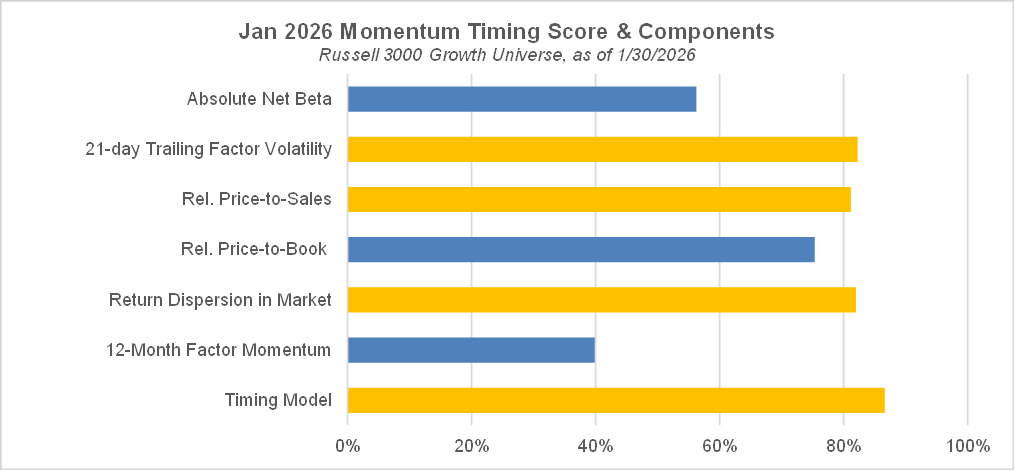
Our momentum timing model continues to indicate that high momentum stocks have a high probability of under-performing in February. The model’s indication is supported by 3 of the 6 underlying variables: the return dispersion within the market observed last month, the trailing 21-day momentum volatility, and the relative price-to-sales multiple of high momentum stocks. High momentum stocks outperformed last month but concerns about crowding are starting to rise.