While the conflict with Iran still lingers, it seems to have moved into a new phase with the announcement of a ceasefire in early April, which so far has held despite occasional skirmishes. The shift from a hot war to an economic war has been celebrated with unbridled enthusiasm by equity markets, with the S&P 500® rising nearly 14% from 3/30 to 4/30. While a substantial percentage of the global supply of energy and key commodities is still choked off by the conflict, the market seems to be dismissive of the economic impact, as if it was taunting in the way my 6-year-old would: “même pas peur!” (not even afraid!). After peaking above 30 at the end of March, the VIX index now sits near 17, and a plurality of indicators (stock return correlations, factor performance, ETF flows) confirm the sharp shift in investor sentiment. The market’s optimism is not unwarranted though. The Q1 2026 earnings season has been very strong, with aggregate YoY earnings and revenue growth rates not seen since late 2021/early 2022 as the economy was recovering from the pandemic (even though that strength was driven largely by mega cap tech stocks). After a brief slowdown in Q4 due to the government shutdown, the US economy has grown at a +2.0% annualized rate in Q1 and GDPNow expects +3.7% for Q2 (as of May 8th). In an indication that the US economy is rebalancing towards less consumption and more production, the manufacturing side of the economy is showing signs of strength, with robust manufacturing ISM readings and accelerating core capital goods orders. Some may argue that too much of the recent GDP growth is driven by investments in AI infrastructure, but this shift towards manufacturing has the advantage of making the economy less dependent on the consumer, which is showing signs of strain (depressed consumer sentiment, rising delinquencies…). Even the notoriously lagging employment indicators are showing signs of a rebound in the job market, as illustrated by the recent ADP and non-farm payroll reports. As of the end of April, the KKT index sits at 52.3%, a reading that is consistent with the US economy being far away from recession territory, and likely still in early cycle phase.
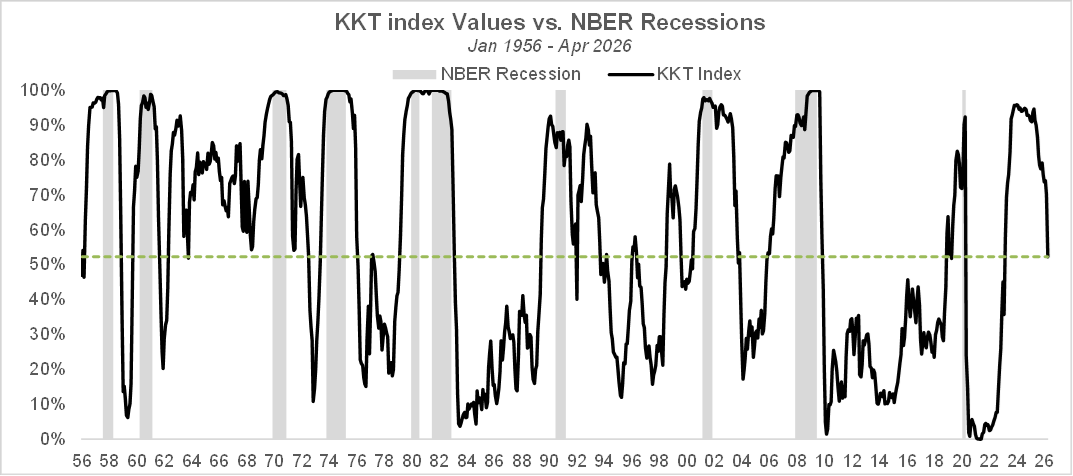
The methodology behind the KKT model is explained in the research paper below:
A NEW INDEX OF THE BUSINESS CYCLE by William Kinlaw, Mark Kritzman, and David Turkington
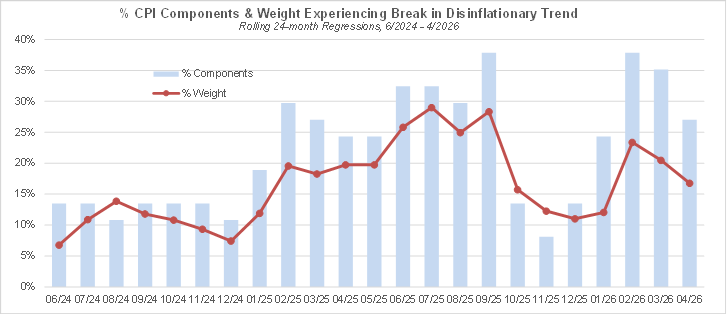
However, a potential fly in the ointment would be the emergence of a renewed inflationary impulse. As shown below, since December, the breadth of CPI components that have experienced an upward inflection in their inflation trajectory (since overall inflation started decelerating in the summer of 2022) has risen meaningfully, even though only a minority of the components have been impacted so far. PCE inflation (the Fed’s favorite yardstick) has also experienced some acceleration since last summer. During the latest FOMC meeting, three members dissented against easing bias in the statement’s language, suggesting that monetary policymakers are getting uneasy about the prospects of a resurgence in inflation.
This emerging inflationary impulse predates the war with Iran, but the geopolitical context is not helping. While the impact of the oil shock on consumer prices is expected to be short term, past major oil shocks have led to permanently higher oil prices, accompanied by a bout of inflation, as the shock propagates to the various components of consumer spending with various lags. Lingering doubts regarding the reliability of deliveries through the strait of Hormuz may lead importers to favor regions that are not (or less) subject to geopolitical risk, especially the US, and as a result, US produced oil may trade at a premium going forward. While this would be great for domestic energy producers, US consumers would likely face higher consumer prices as a result.
Economists typically view higher oil prices as a tax rather than the cause of sustained inflation. The idea is that as prices of necessities (utilities, transportation, food) go up, consumers respond by cutting back on discretionary spending, which in turn depresses the prices of non-essential goods and services, resulting in muted overall inflationary pressures. However, it is not clear that discretionary spending may suffer a significant decline because of the current oil shock. First, financial services firms’ ingenuity in creating new ways for consumers to access credit should not be underestimated. Besides, the two-speed nature of the US economy – where the wealthiest 10% of consumers, which are less sensitive to inflationary pressures, drive 50% of overall expenditures – makes aggregate spending more resilient to a rise in consumer prices. The most recent retail sales data suggest that so far, discretionary spending is holding up in the face of rising energy prices.
Furthermore, the rise in energy prices may have inflationary effects in the longer term, as it may cause a push for stimulative fiscal and monetary policy measures. Given that affordability is already a political issue, further increases in the price of necessities may lead candidates to promise such stimulative measures to placate their constituents in view of the midterms. Demands for higher wages and strikes may also become more prevalent among workers subject to collective bargaining agreements, which could cause second round inflationary effects. For now, it is primarily a social and political issue, but it may become an economic one after the midterms if newly elected politicians start to push for more stimulus.
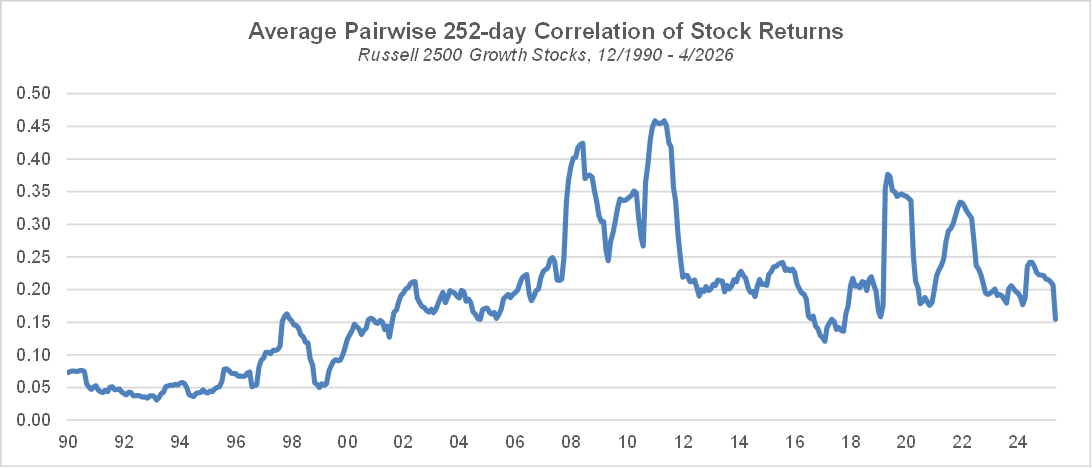
The long-term measure of sentiment we follow, the average pairwise correlation of stock returns, dropped sharply last month and is now like its pre-COVID lows. While this measure is still nowhere near the historical extreme of 12/1999, the sharp drop caused by the recent market action is indicative of a major peak in risk-seeking sentiment.
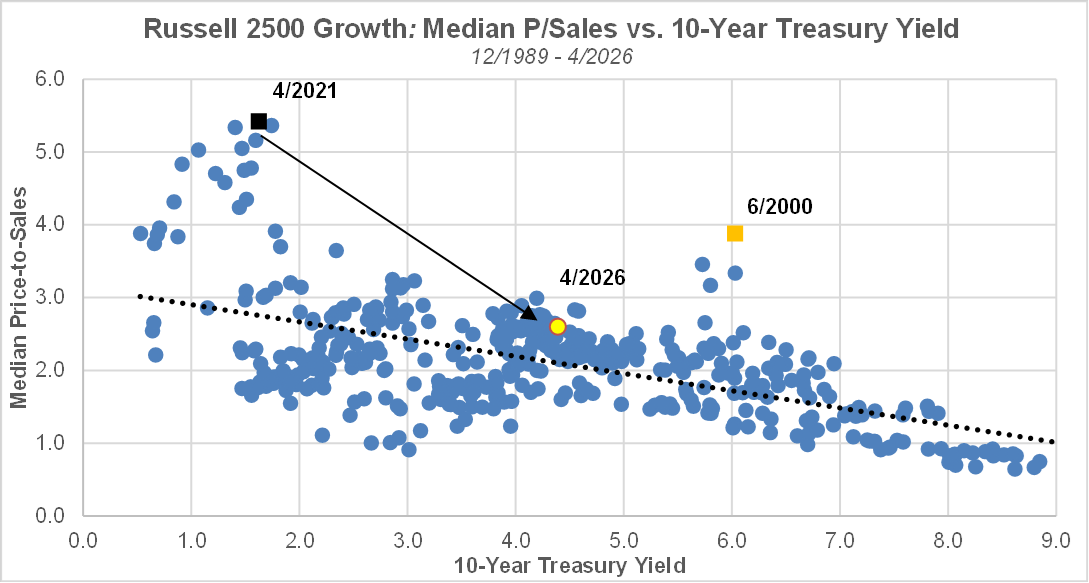
In the small and mid-cap growth universe, despite the sharp stock market rebound in April, the median price-to-sales multiple remains at a level that is consistent with the 10-year Treasury yield (albeit at the higher end of the range given the current yield), muting the broader valuation concerns which are related to a handful of mega caps.
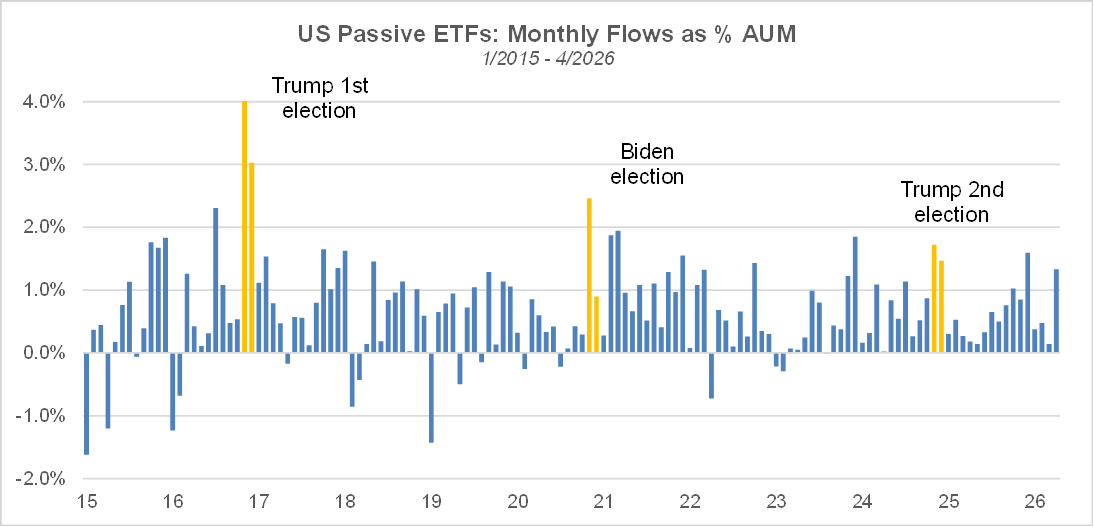
Despite the geopolitical uncertainty, passive ETFs have experienced strong inflows in April, that are similar in magnitude (in terms of % of AUM) to those seen in 12/2025 and in the aftermath of Trump’s election in late 2024. Passive investment vehicles, which provide price insensitive demand for equities, continue to support the stock market.
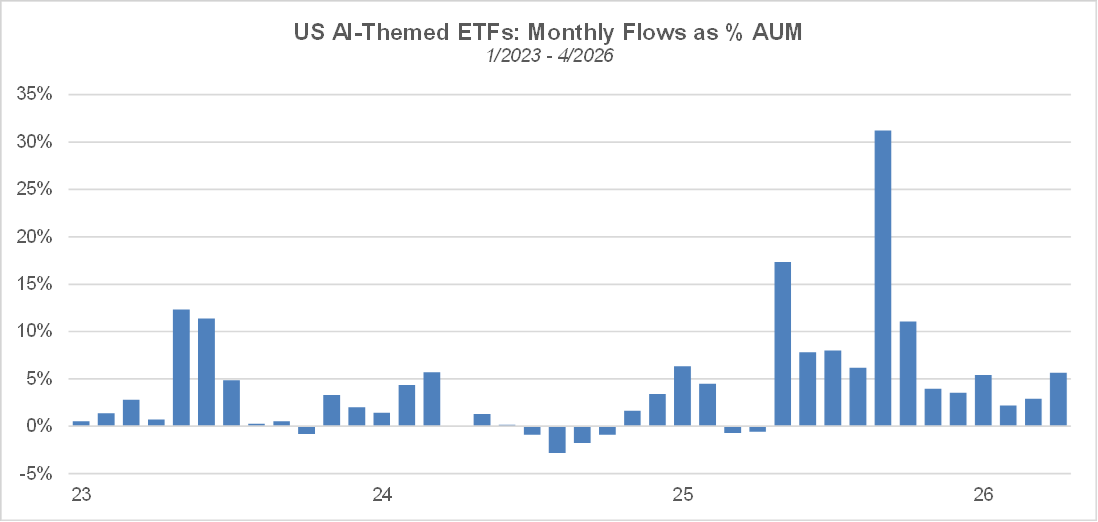
In addition, flows into AI ETFs continue to be robust – they even picked up the pace in the past couple of months – and to defy concerns that the theme may be in a bubble.
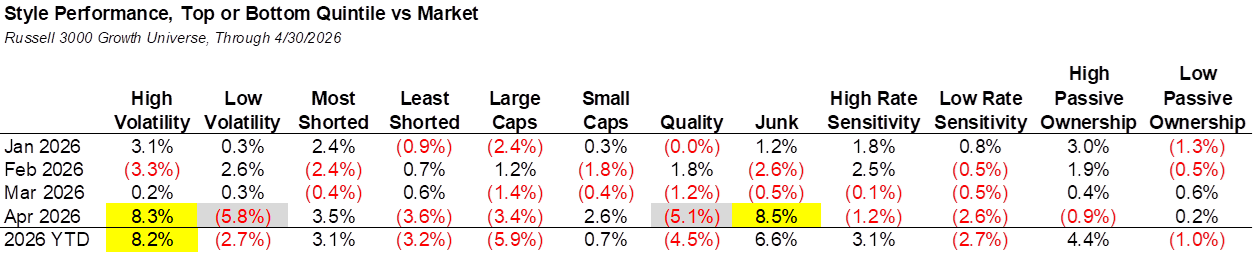
Style performance patterns reflect the strong risk-on environment that prevailed last month, with high volatility, junk, and small caps out-performing substantially, and low volatility, high quality, large caps under-performing materially. Besides, in the current, uncertain macro environment, stocks with high passive ownership have fared well so far this year and showcase the positive feedback loop between passive fund flows and market performance.
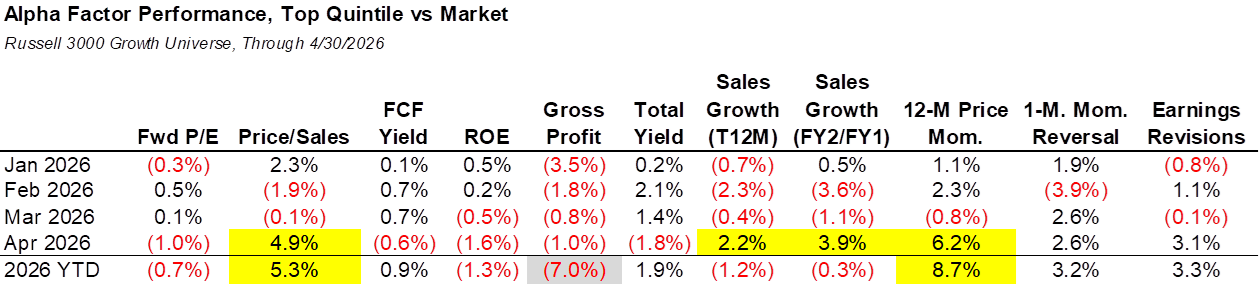
Within the factor space, top ranked stocks – in terms of price-to-sales, revenue growth and price momentum –exhibited strong performance last month. By contrast, high profitability and high yielding stocks underperformed.
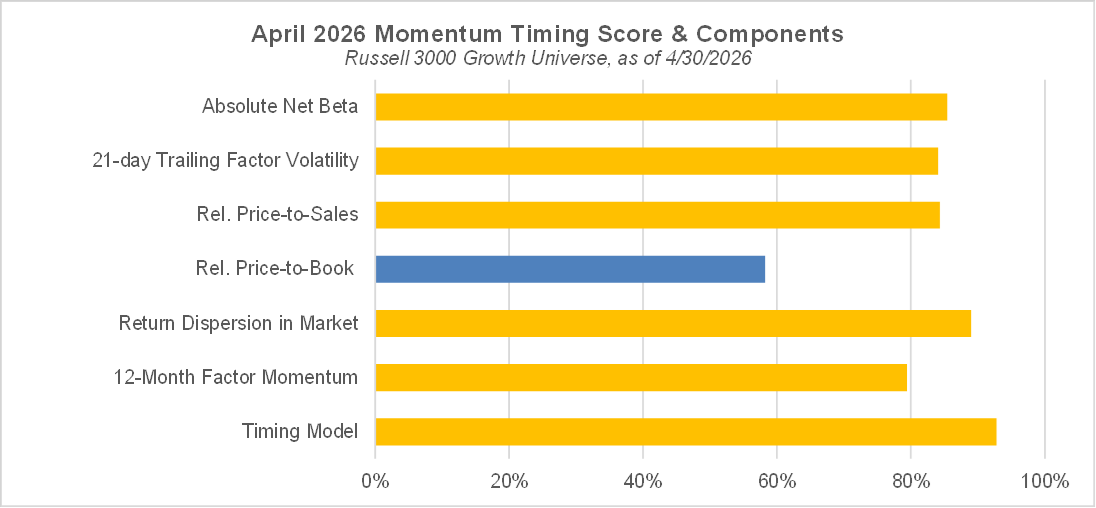
Even though high momentum stocks have substantially outperformed so far this year, and especially last month, our momentum timing model continues to indicate that high momentum stocks have a high probability of under-performing in May. The model’s indication is supported by 5 of the 6 underlying variables, which are in the 80th percentile or above: the absolute net beta of the momentum factor, the trailing 21-day momentum volatility, the relative price-to-sales multiple of high momentum stocks, the dispersion of stock returns within the market, and the 12-month momentum of the momentum factor.
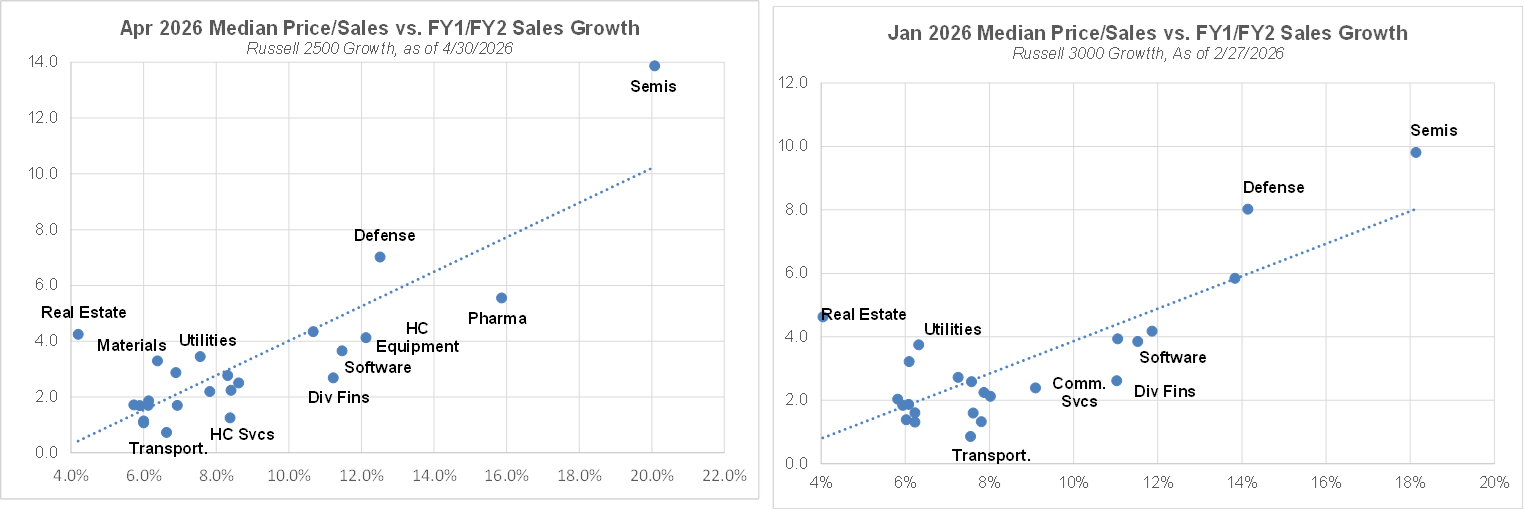
Within the cross section of industry groups, there is typically a high correlation between the median price-to-sales and the median FY2/FY1 revenue growth rate, which can help identify which industries are over/under valued. As of the end of April, semis, defense, utilities, and real estate continue to be over-valued relative to growth expectations. Materials have also joined the over-valuation club, which is not surprising given the sector’s strong performance year-to-date. By contrast, pharma, healthcare equipment, software and diversified financials appear undervalued relative to growth expectations.