“Socialist governments traditionally do make a financial mess. They always run out of other people’s money.”
— Margaret Thatcher, interview, This Week Thames TV, 5 February 1976
In 2024, the stock market was booming and, if economic data – especially the payroll numbers – were to be believed, the economy was also doing well. That didn’t seem to match with people’s perceptions though, with some polls during the summer of 2024 showing that a significant percentage of Americans felt the economy was in recession. Some economists were wondering why all this negativity when the economy was obviously doing so great, apparently oblivious to people’s complaints about the cost of living and college graduates’ struggles to get their first job. The economy and inflation were on top of voters’ minds when the presidential election came about, but some were surprised when the candidate who offered concrete solutions to bring some relief on those issues – like no tax on tips or lowering energy costs by increasing oil drilling in the US – won the election by a wide margin. Notably, compared to the 2020 election, his share of the vote increased by ~6-8% among young adults and by ~4% among working class voters. Even though they may have disagreed with his tone or some of his ideas, voters found in Trump someone who was willing to address their economic struggles and decided to give him a second chance.
Fast forward to today, like Captain Renaud in Casablanca, many were shocked that a far-left candidate won the mayoral election in NYC easily. His opponents were certainly right in criticizing his economic policy proposals as too costly and unrealistic, but they didn’t offer any concrete alternatives. However misguided his proposals may be, Zohran Mamdani showed the people of New York that he cared about their problems. At least he took the time to meet people in young, working-class neighborhoods of the city where Trump happened to win a large share of the vote. Once the election euphoria fades though, the new mayor – who comes from a family of intellectuals and artists and lacks significant professional experience – will get a crash course in economic reality. Socialist ideas look great on paper – who doesn’t like free stuff? The problem is that someone must pay for those goodies and, as Margaret Thatcher said in the quote above, eventually you run out of other people’s money as social programs inevitably grow too big. As has happened already over the past few years, more high-income earners may decide they’ve had enough and leave for Dallas or Miami. If my experience as a French citizen serves as a guide, the (upper-) middle class will end up picking up most of the tab.
Now, I suspect that what just happened in NYC may not stay in NYC, because the penchant for socialism among younger Americans (Gen Z and Millennials) extends far beyond NYC limits. Polling done in recent years shows that nationwide, ~50% of Gen Z and Millennials have a favorable view of socialism – with that percentage reaching 62% among Gen-Zers in a Cato Institute poll from May 2025 – while that percentage drops to 30-40% among Gen-Xers and Boomers. The best rationale that I can think of for such a generational pattern is related to the policy response to the GFC. At that time, policymakers favored expediency over justice, probably not measuring the long-term consequences of their decisions. Gen-Zers, who were kids at the time, saw their parents lose their jobs, their savings, their homes while the bankers who caused the crisis appeared to have gotten away with it. This may help explain their broad disdain towards what they perceive as being capitalism. These negative feelings are certainly strengthened by their current struggles, as the lack of good paying jobs and record low home affordability make it harder for them to advance their station in life. Of course, most of them don’t have the faintest idea of what it means to live under a socialist system, but the real tragedy is that the financial and business elite, who rightfully denounces the dangers of socialism, has lost credibility after receiving hundreds of billions in taxpayer funded bailouts over the past 15 years. The risk is that, as the saying goes, those who learn from history can only watch helplessly as those who don’t learn from history repeat the mistakes of the past.
The stark differences in perspectives between generations on fundamental topics like which economic system the country should pursue fit within the cyclical theory of American history as explained by William Strauss and Neil Howe in their book The Fourth Turning (1997). The authors view history as a succession of 80-100 year (a human lifespan) cycles, each of which is decomposed in four 20-25 year phases called turnings, and each turning is shaped by the generation that comes of age at that time. The first turning corresponds to a period of post crisis renewal, with strong institutions that inspire confidence (for example, the post-World War II boom). The second turning typically sees authority get challenged and some societal reforms (for ex., the cultural revolts and Vietnam war protests in the mid-1960s and 1970s). The third turning is a period when institutions become weaker, and individualism rises (mid 1980s to early 2000s). Finally, the fourth turning (which we have been in since 2008 and is expected to last until the mid-2030s) is characterized by significant upheaval, a breakdown and rebirth of institutions under a new order. In the prior two cycles, the fourth turning has ended with major wars (the Civil War and World War II) and a significant spike in inflation. As we are entering the latter part of the current fourth turning and geopolitical tensions between the Western and Eastern blocs are escalating, it is reasonable to expect inflation to rise over the next decade.

Lawrence H. Officer and Samuel H. Williamson, “The Annual Consumer Price Index for the United States, 1774-Present,” MeasuringWorth, 2025,
URL: http://www.measuringworth.com/uscpi/
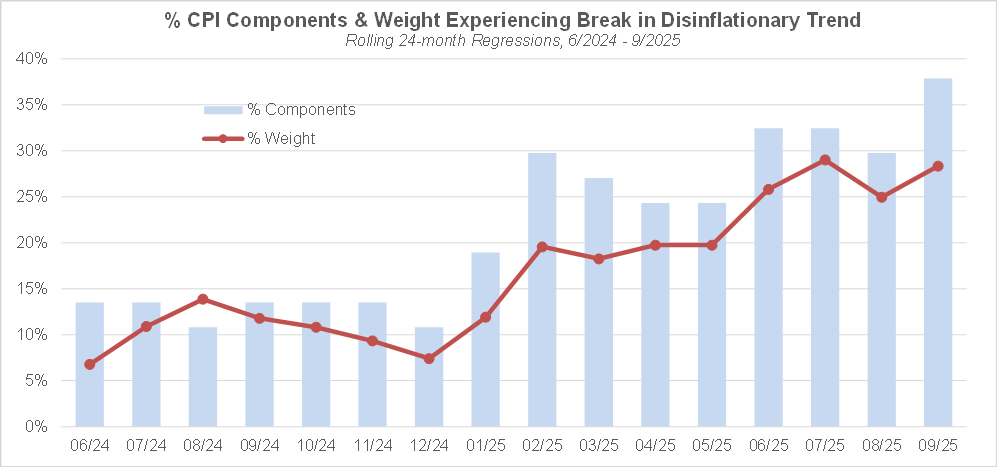
So far though, after a spike in 2021/2022, US inflation has come back down to ~ 3%. However, the absence of further progress towards the Fed’s 2% target over the past year or so raises concerns that inflation may start to rebound in the next few months. The robust growth over the past two quarters, which suggests that the economy is rebounding, combined with a loosening of monetary policy that is likely going to continue under the upcoming Trump appointed Fed chair, lends credence to those concerns. The chart below shows that while headline inflation has remained stable over the past 15 months, the breadth of components (and their aggregate weight in the index) experiencing a break in the disinflationary trend since the peak in inflation in the summer of 2022 has been on a rising trend. However, note that the breadth of components experiencing an inflection in their inflation trajectories is still well below 50%.
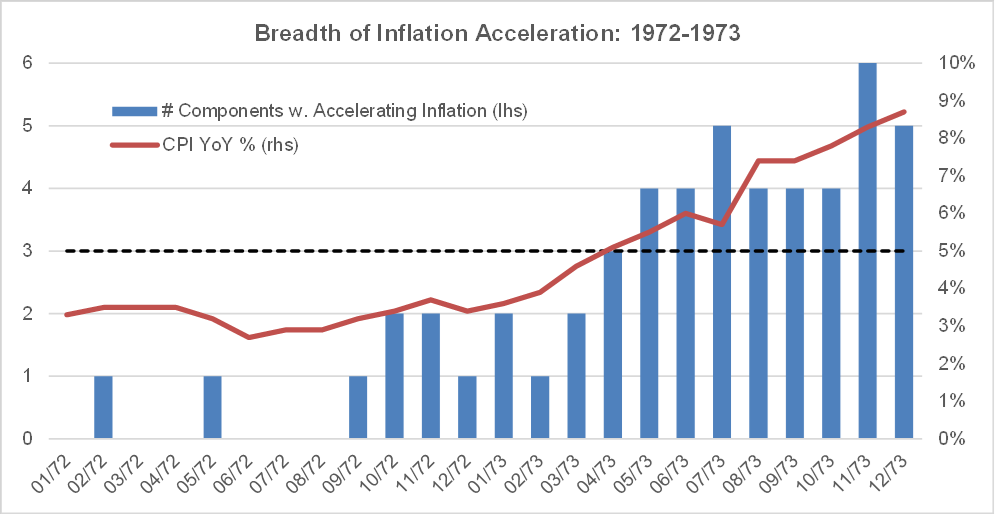
The historical precedent of 1972-1973 suggests that it is worth paying attention to the breadth of CPI components that are experiencing some acceleration in inflation. At that time, the acceleration in headline inflation was accompanied by a rising breadth of components experiencing some acceleration. By the time breadth of acceleration reached 3 out of 8 major components in April 1973, headline inflation crossed 5% and kept rising until December 1974. Note that the decomposition of the CPI in the recent breadth chart is not the same because 1970s era data is not available for some of the modern component definitions. Instead, the analysis below is based on a decomposition of the CPI into 8 major components, for which the historical data does exist.
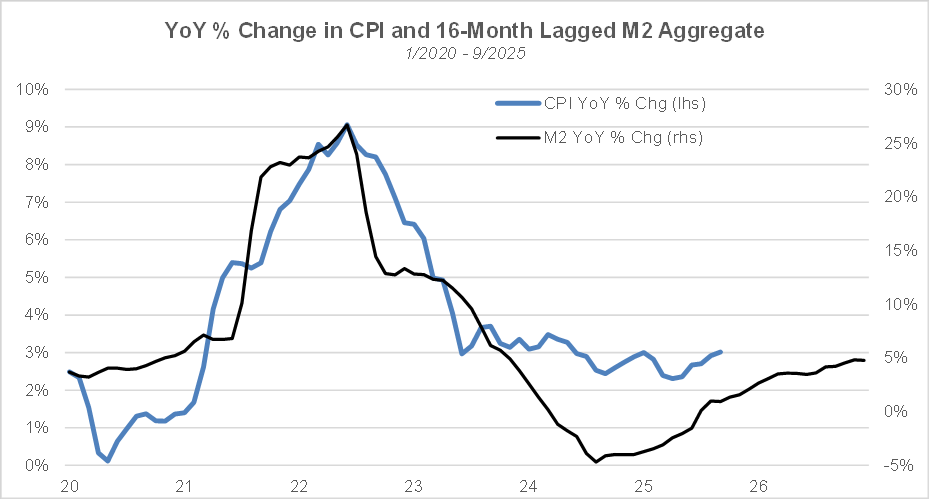
Since 2020, headline inflation has been highly correlated with 16-month lagged changes in the year-over-year growth rate in the M2 monetary aggregate. After bottoming in April 2023, M2 growth has kept rising so far. If the relationship between inflation and the lagged growth in money supply held perfectly, inflation should have bottomed out in August 2024. So far, it looks like the bottom occurred in April 2025, with inflation steadily rising over the last 6 months.
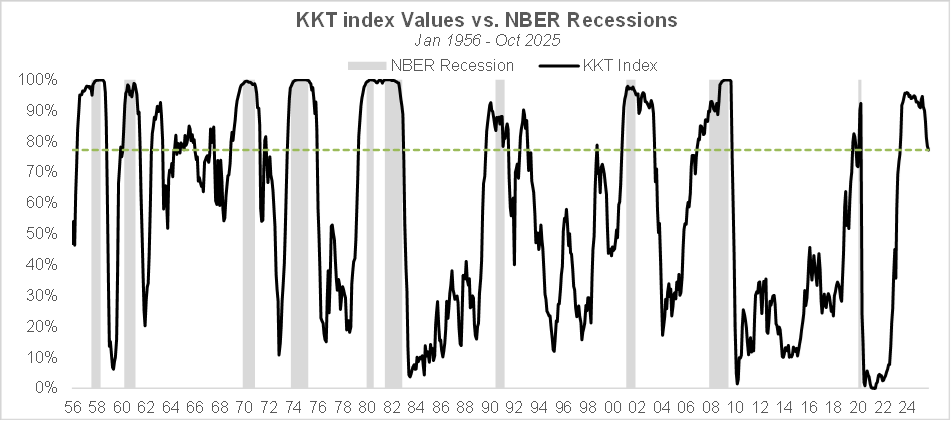
We are almost flying blind in terms of assessing where we are in the economic cycle since we have just come out of the longest government shutdown in U.S. history, as agencies like the BLS or the BEA had to stop providing updates to economic statistics. Alternative data sources do provide some clues, but their indications are not always aligned. One notable exception is the CPI data which was exceptionally updated so that cost of living adjustments could be calculated. Our favorite indicator to assess the state of the economy, and more specifically the relative proximity of current conditions to periods of robust economic growth vs. recessions relies on two market-based indicators (the stock market and the yield curve) and two economic indicators (industrial production and payrolls). Given that the latter two have not been updated because of the shutdown, we can’t determine the exact value of the KKT index, but it is possible to run an update relying on estimates of the latest payroll and industrial production numbers based on non-government related proxies.
Job creations from the ADP report, which is typically issued 1-2 days ahead of the payroll report, have historically had a strong correlation (0.72 over the last 5 years) with the number of new nonfarm payrolls. After two consecutive months of declines, payrolls per ADP have rebounded in positive territory in October suggesting that the US job market, while still weak, could be recovering. A simple univariate linear regression model based on data since 1/2021 would imply moderate nonfarm payroll creations for the months of September and October.

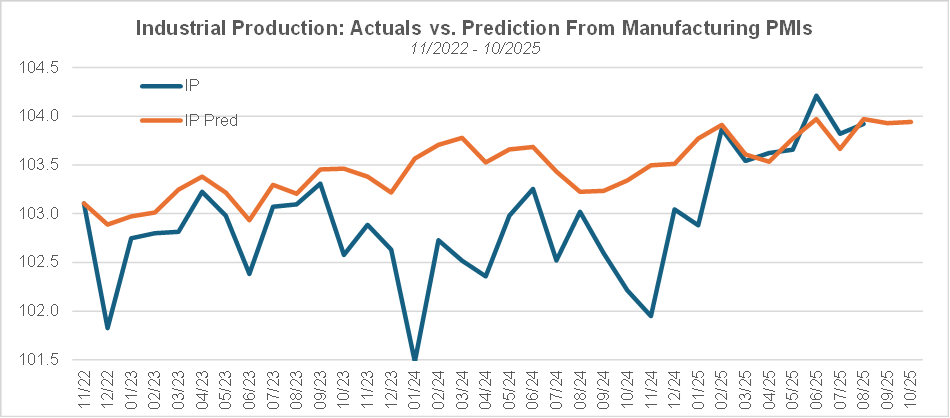
Imputing the missing industrial production data is a lot more challenging. The best available proxies I could find were the S&P Global’s manufacturing PMI and the production sub-index of the ISM manufacturing PMI which, when combined in a linear regression model based on data over the past 3 years, provide estimates of month-over-month growth in industrial production that have had a 0.33 correlation with the actual numbers. This model leads to predictions of roughly stable industrial production over the last 3 months.
Based on the imputed values of the payroll and industrial production numbers, the KKT index has dropped further at the end of October, from 78.4% to 77.2%, and continues to suggest that the economy is moving out of recession, not getting into one. GDPNow (even though its estimates should be taken with an appropriately sized grain of salt) also seems to suggest that the economy is nowhere near recession territory, with an estimate of 4% GDP growth for Q3 as of 11/6. Given the robust economic growth that has occurred in Q2 and was also likely in Q3, a soft patch in Q4 wouldn’t be a huger surprise, given that the shutdown has had a detrimental impact on economic growth. The K shaped nature of the economy – with 10% of income earners driving half of consumer expenditures – causes our intuition to be misleading. While many Americans struggle with the high cost of living and young adults have a hard time finding jobs, a minority of wealthier and typically older Americans have enjoyed a significant wealth effect from the rise in financial assets, along with substantial interest income from their savings thanks to the high Fed funds rates. Not to mention that many of them (re) financed their home with a COVID era low-rate mortgage. As a result, that cohort can withstand cost of living increases and doesn’t feel any hint of recession. The downside of this unequal economic model though is that the government must spend increasing amounts on welfare benefits (as more and more people get excluded from the productive part of the economy) to keep together an already very divided and polarized society, which likely means growing debt and deficits. A visual metaphor for the current US economy is that of a modern, high speed train locomotive pulling an increasingly heavy caboose. At some point, the cost of preventing the caboose from tipping over and derailing the entire train may just become too high.
The methodology behind the KKT model is explained in the research paper below:
A NEW INDEX OF THE BUSINESS CYCLE by William Kinlaw, Mark Kritzman, and David Turkington
The generational divide in terms of spending power is evident in the year-to-date performance of staples & discretionary stocks, depending on which generations of consumers those companies primarily cater to. The analysis below relies on a classification, performed by ChatGPT, of the 224 consumer companies in the Russell 3000® Growth in terms of which generations (Gen Z, Millennials, Gen X, Boomers) dominate their customer base. While the companies catering to younger generations and those catering to older consumers have performed similarly until the end of June, consumer companies whose customers are primarily Gen Z or Millennials have under-performed those serving older customers by ~500 bps since July. Coincidently, starting in the summer of 2025, the administration has been increasing enforcement on wage garnishment in case of delinquent student loans. The student loan issue provides further fuel for the younger generations’ discontent and could even become a topic of focus in next year’s midterms. In that context, it wouldn’t be surprising if the current administration quietly walked back its initiatives to collect unpaid student debt in the months ahead.

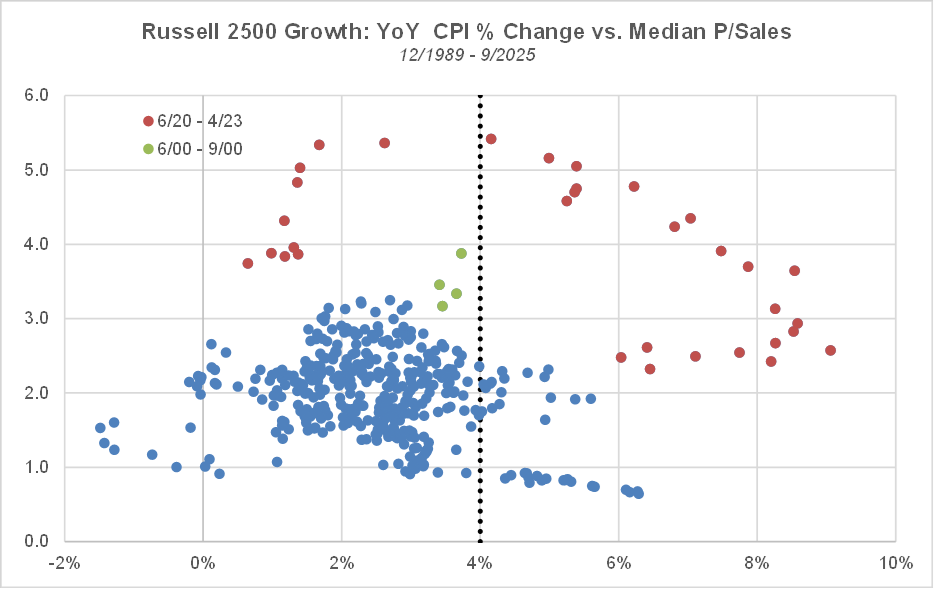
Besides its impact on the economy, the rate of inflation also influences market valuations. In last month’s note, I have shown long term empirical evidence (based on the S&P 500) of an inverted U-shaped relationship between inflation and the market’s Shiller P/E multiple. The “sweet spot” for optimal market valuations has historically corresponded to CPI inflation being in the 1% to 4% range, and the multiple tends to cliff dive (with rare exceptions) when inflation declines below 1% or rises above 4%. A key question for us is whether that observation also holds for the specific universe of small & mid cap growth stocks. While there is much less data available – our historical database on growth stocks only goes back to the late 1980s – the empirical evidence at our disposal suggests that the inverse U-shaped relationship between inflation and valuations also applies in the small & mid cap growth universe. As shown below, if we treat the COVID period (from 6/2020 to 4/2023) as an anomaly, should inflation rise past 4%, the median price-to-sales multiple in SMID growth is likely to experience significant compression.
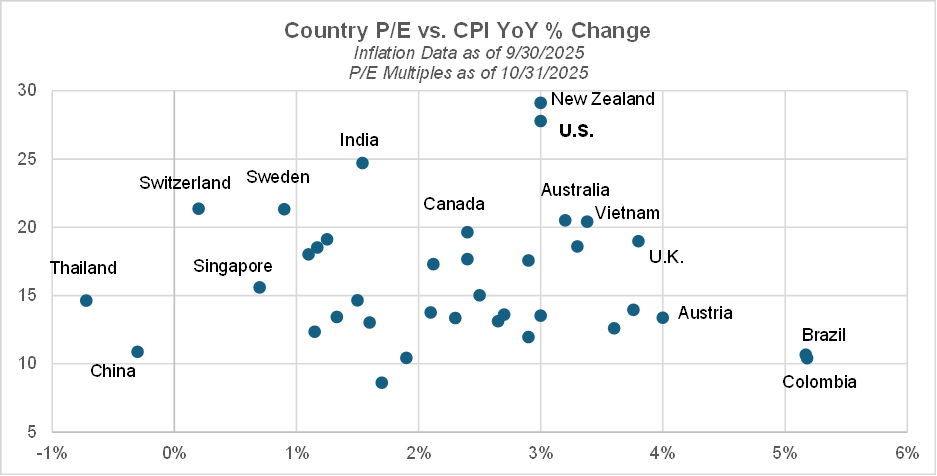
The inverse U-shaped relationship between inflation and market valuations is also evident in the cross section of global equity markets. The chart below shows 40 countries’ inflation rates and P/E multiples based on the latest data available as of 10/31. While the relationship is noisy – since inflation is far from the only factor influencing valuations – we can see that countries like Brazil (which has a >5% inflation rate) and China (currently experiencing deflation) trade at P/E multiples near 10, while the U.S., New Zealand and India, which have inflation rates in the 1% to 3% range, are trading at multiples above 25.
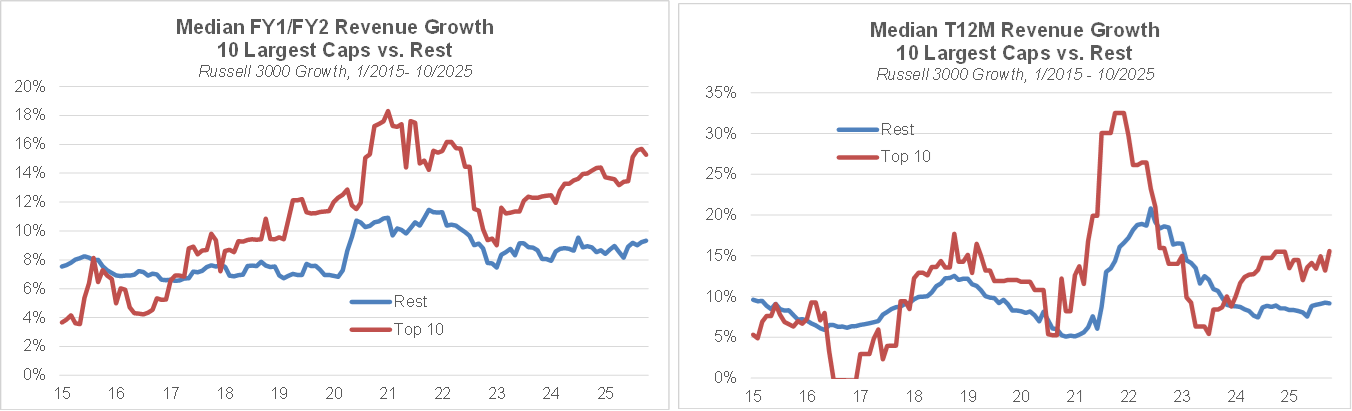
It’s not just the economy that is K-shaped. Within financial markets, there are also notable disparities between a small number of mega caps and the rest of the market. The chart on the left shows the median FY1/FY2 revenue growth for the 10 largest caps vs. the rest of the Russell 3000® Growth since 2015 and reveals a K shape in terms of growth expectations, with strong and rising growth expected from the top 10 and far more muted growth expected from the other constituents. As the chart on the right shows, over the past two years, the 10 largest caps have indeed grown their revenues at a much faster pace than the rest of the growth universe.
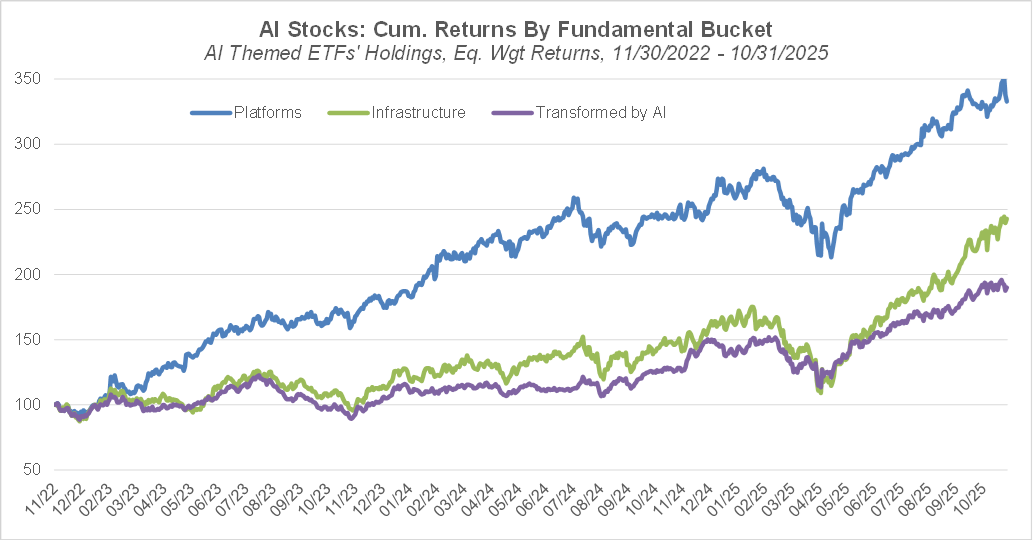
The K-shaped dynamic also applies within the realm of AI stocks. Since the release of ChatGPT in late November 2022, the three major AI platform companies (Meta, Google, Microsoft) have left other AI related companies in the dust, with no sign of any impending rotation between sub-themes within AI. My intuition is that a peak in sentiment needs to be reached before we start seeing some rotation. A clear sign of such a peak would be an IPO of OpenAI, which seems to be in the works but is not very likely to happen soon. Timing extremes in sentiment is a very difficult endeavor and the current bullish sentiment towards prominent AI companies can persist much longer that anyone expects. Regarding methodology, the chart below is based on the membership of ETFs that FactSet has classified as belonging to the “Robotics & AI” theme, and stock returns are equally weighted. Within that set of “AI stocks”, I classified those that belong in the IT hardware industry group into the “Infrastructure” bucket, and the non-tech stocks into the “Transformed by AI” bucket. Note that this classification is far from perfect since it doesn’t account for the fact that many non-tech companies (for example those providing cooling solutions for data centers) are in fact part of the AI infrastructure sub-theme.
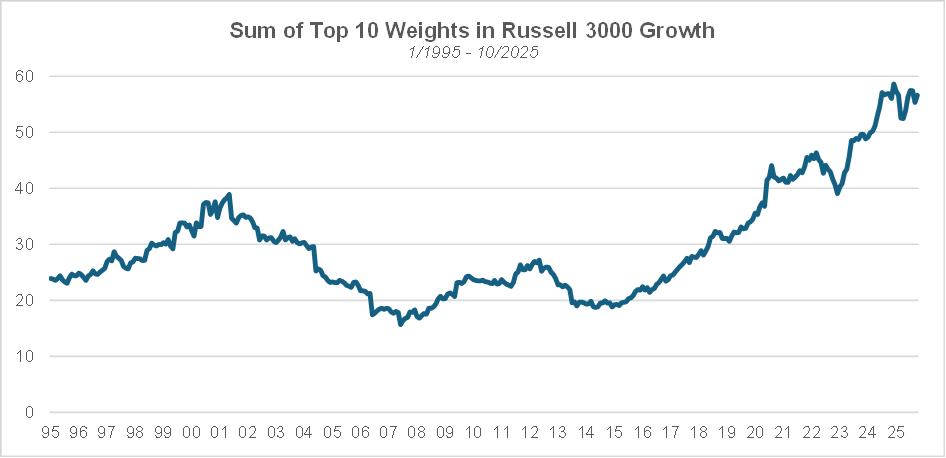
The continued outperformance by mostly AI related mega caps has led to unprecedented levels of market concentration. Ten years ago, the largest 10 stocks in the Russell 3000® Growth represented only ~20% of the index. As of October 31st, their aggregate weight was ~57%. Such concentration levels are especially challenging for large cap and all cap managers, since any decision to not have exposure (or be underweight) to any one of those stocks increases risk significantly.
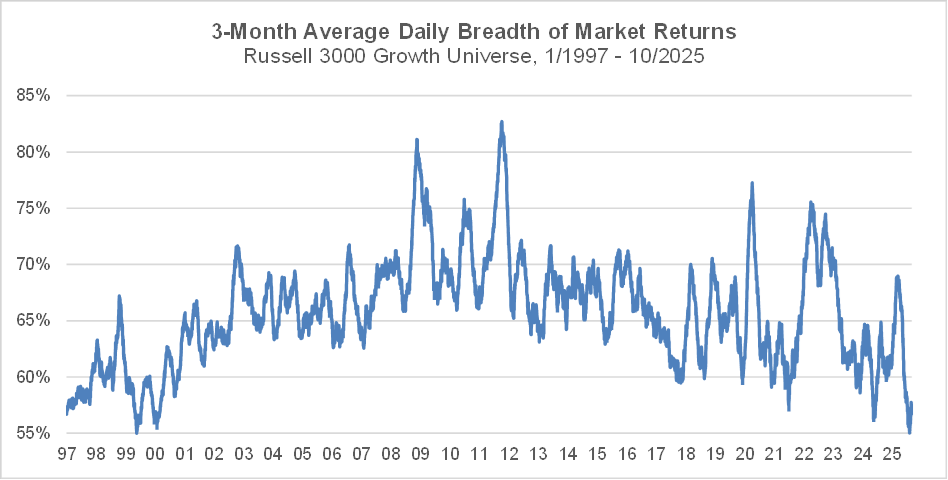
The increase in market concentration has gone hand in hand with a decline in performance breadth. The chart below shows the daily 3-month rolling average of the percentage of stocks within the Russell 3000® Growth that moved in the same direction as the overall market. Breadth has been on a declining trend over the past 10 years, recently (on Oct 3rd) reaching a low that had previously been reached in May 1999 and providing additional material to those comparing the current environment with the internet bubble of 25 years ago.
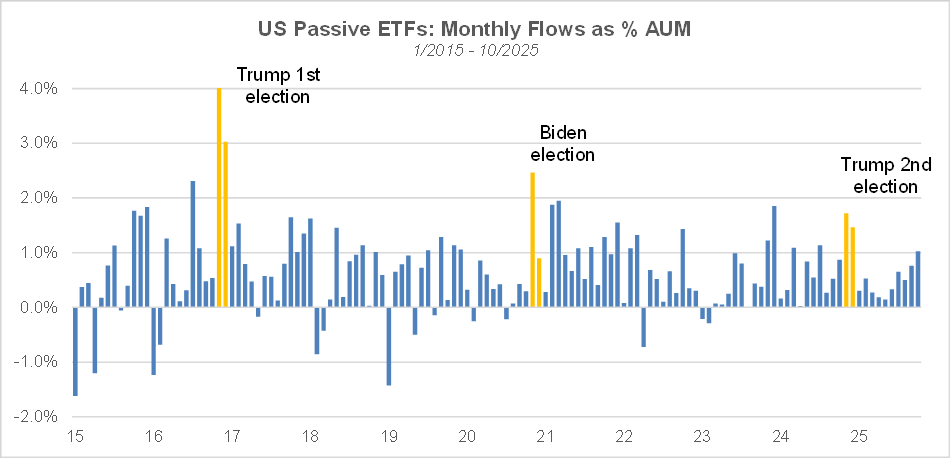
After a notable deceleration between February and May, flows into passive ETFs have experienced a renewed acceleration, contributing to the rise in equity markets since then, and providing yet another confirmation of investors’ risk seeking sentiment.
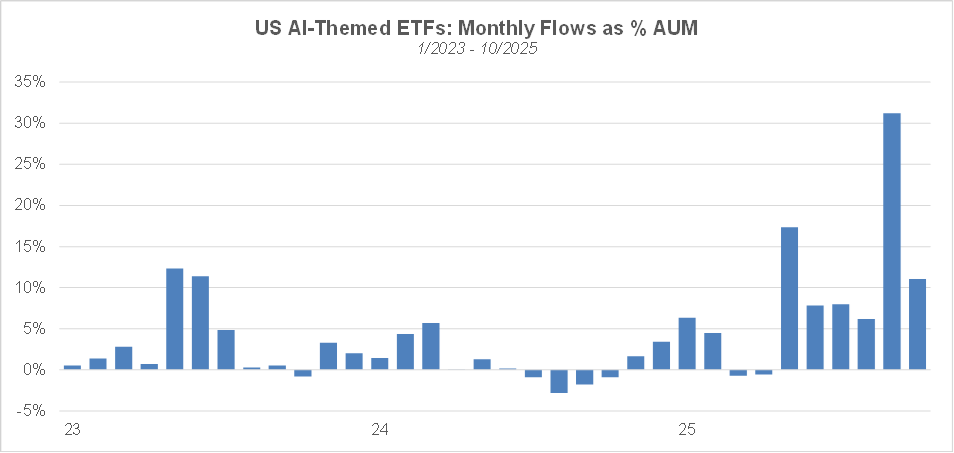
Flows into active and thematic ETFs have also been robust in recent months. As shown below, flows into “robotics & AI” themed ETFs, as a percentage of the previous month’s AUM, have reached a record high in October and have continued to be strong since. The pace of creation of new ETFs dedicated to the AI theme has also been brisk. When we launched our AI portfolio in June 2023, there were only 14 AI themed ETFs in FactSet’s database. Since then, 9 were launched in 2024 and 10 so far this year.
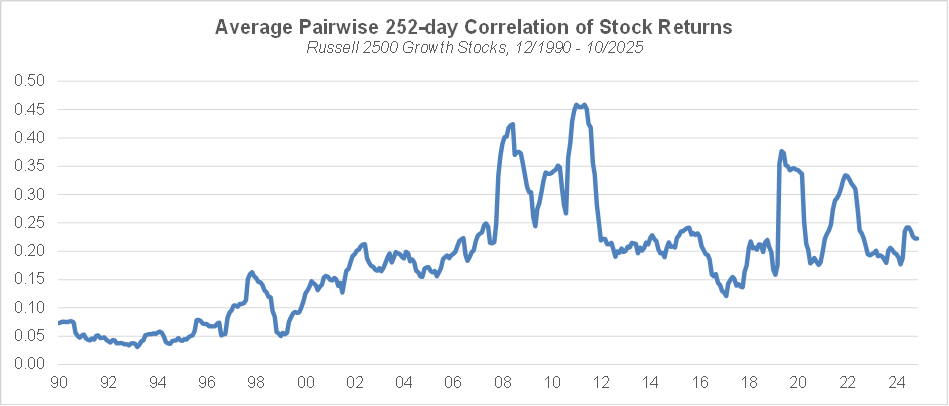
Our long-term measure of sentiment, the average pairwise correlation of stock returns, at 0.222 is right at the median of post GFC historical values, and nowhere close to the 0.158 level reached in 1/2020, much less the 0.05 low from 12/1999, suggesting that investors’ risk seeking sentiment is not that extreme.
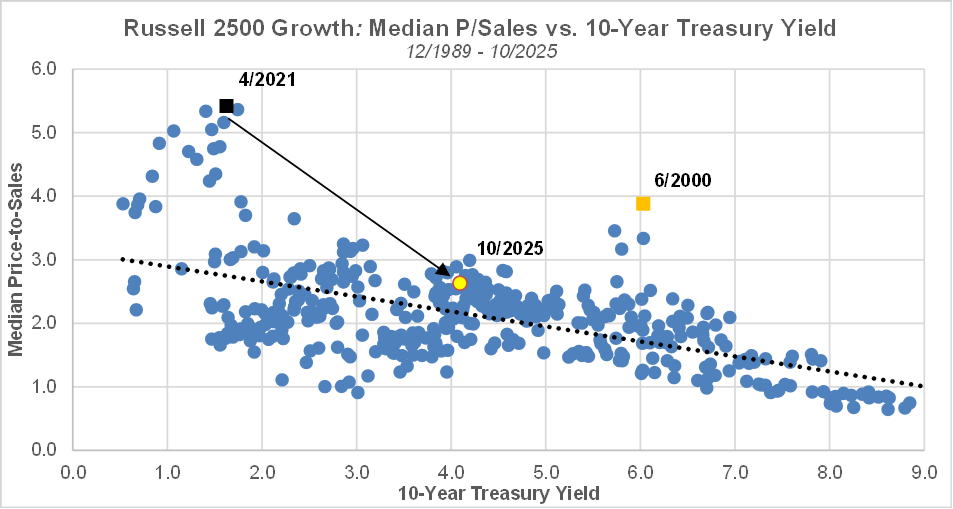
Despite the strong risk seeking investor sentiment and the increasing occurrence of the word “bubble” in market commentaries, the median valuation for small & mid cap growth stocks has not changed substantially since last month and has even become marginally more attractive. In that space, the median price-to-sales is broadly consistent with the current level of the 10-year yield, and nowhere near the extremes reached in 6/2000 and 4/2021. Given their weight in market indices, the AI-related mega caps have an outsized impact on the market’s overall valuation, but those very large trees hide a forest of companies who don’t appear to be substantially over-valued.
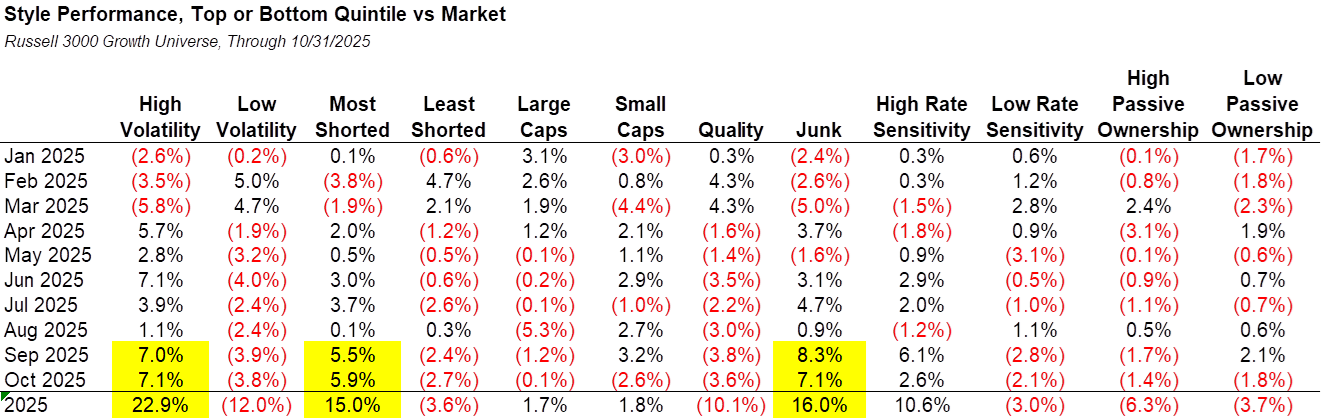
A key benefit from looking at the performance of quant factors is that they reveal insights into investors’ preferences. In particular, the performance of factors – like high vs. low volatility stocks – that are sensitive to macro regimes provides indications on investors’ sentiment and consequently their views on the state of the economy. Last month, high volatility, most shorted and junk stocks have continued their run, with performance numbers similar in magnitude to those observed in October. By contrast, low volatility and high-quality stocks have continued to under-perform. In recent history, such return patterns have been observed when the economy was in a recovery / early cycle phase. If the economy was in or on the cusp of a recession, we would expect the opposite, i.e., investors’ preference for high quality, stable stocks.
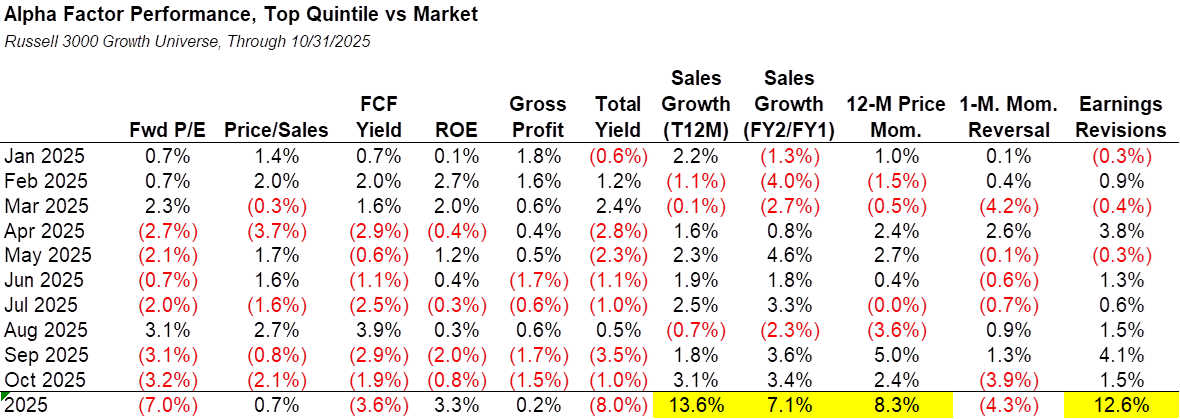
Within alpha factors, price momentum has exhibited strong outperformance for the second month in a row. Sales growth factors also performed very well last month. Year-to-date, the growth-momentum-revisions complex has been the main driver of performance in the factor space. By contrast, value and total yield have fared poorly, while profitability’s performance has been mediocre.
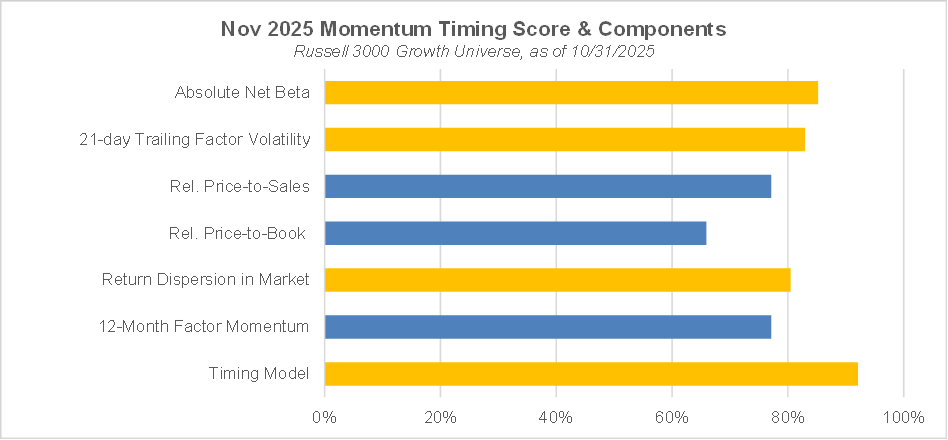
Our momentum timing model continues to indicate that high momentum stocks have a high probability of under-performing in November, but this time, the model’s indication is supported by half of the underlying variables: the return dispersion within the market observed last month, the trailing 21-day momentum volatility and the absolute net beta of the momentum factor. After a strong run in the past couple of months, high momentum stocks are vulnerable to sharp drawdowns, as have been observed historically in many instances.