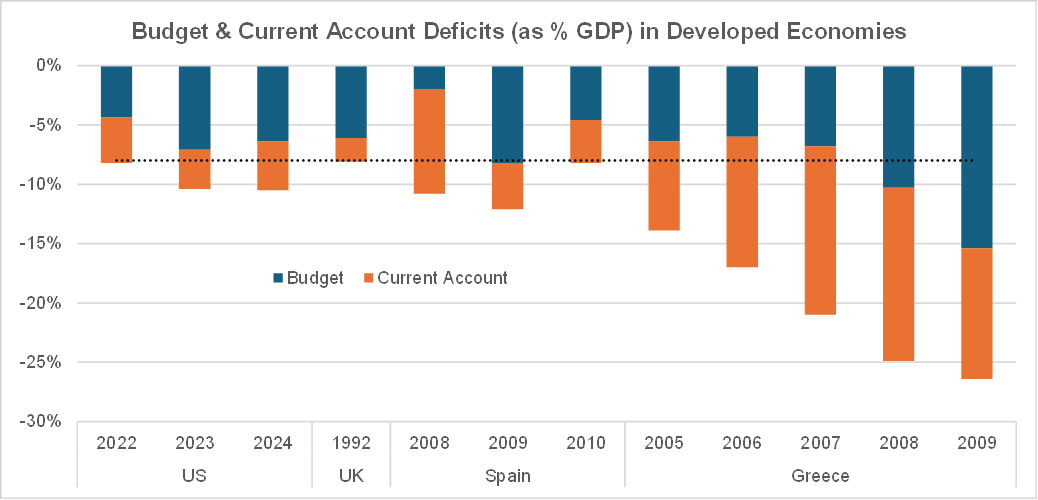
Over the past four decades, the level of public debt in the US has raised concerns periodically but has been largely shrugged off until recently. The large budget deficits in the years following the GFC brought those concerns to the forefront, but the low interest rates that prevailed at the time not only made the high debt burden manageable, but also created the illusion that the US could get away with spending whatever amounts it may choose without consequences. When the COVID crisis arose, the government showed no restraint in the amount of fiscal stimulus it provided to the economy – 27% of GDP for years 2020-2021 (https://taxfoundation.org/blog/us-covid19-fiscal-response), pushing federal spending during the COVID years – as a percentage of GDP – far beyond the levels reached during the New Deal. However, what makes a difference this time around is the resurgence of inflation, which has pushed interest rates, and thus the Federal government’s interest expenditures, much higher than they were during the 2010s, leading to persistently higher deficits, even after the end of extraordinary stimulus measures. Those high budget deficits, on top of lower magnitude but still sizeable current account deficits have led the US to run combined deficits of 8+% of GDP (>10% if one excludes 2022) since 2020. Running high twin deficits (especially if persistently so) has historically led to serious macroeconomic crises, and not just in emerging markets. In 1992, the UK (which ended up with an 8% twin deficit as % of GDP that year) had to withdraw its currency from the European Exchange Rate Mechanism – a precursor to the Euro – as it could not maintain the British pound’s parity with the Deutschemark (George Soros became famous then for – correctly – betting against the pound at the time). In the aftermath of the GFC, Greece and Spain, which had been running high twin deficits for years, suffered severe sovereign debt crises that forced those two countries to endure a decade of painful austerity measures.
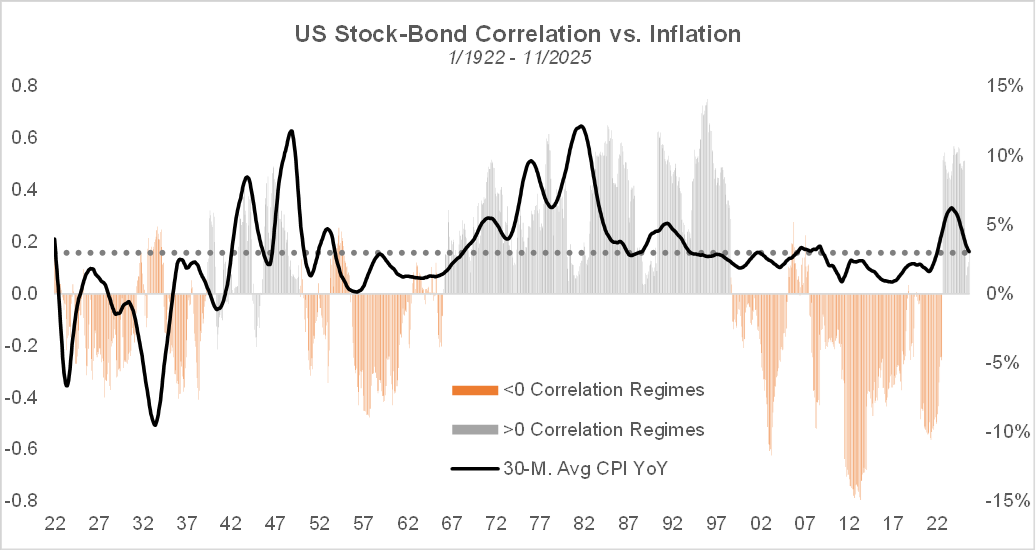
Fortunately, the dollar’s reserve currency status makes foreign investors more lenient towards the US’s large twin deficits. However, those deficits can’t be sustained for very long, because inflation, and thus interest rates remain stuck at significantly higher levels than the pre-COVID norm. Despite the Fed’s best efforts over the past 3 years or so, inflation remains 50% above target. The meaningfully positive stock-bond return correlation that has prevailed since mid-2022 suggests we have entered a higher inflation regime. As shown below, over the past 100 years, periods of high (low) stock-bond return correlation have been associated with relatively high (low) levels of consumer price inflation.
The Trump administration aims to use tariffs to re-shore manufacturing and reduce the current account deficit. However, solving the budget deficit issue is far more challenging. Outright default is obviously not an option. Throughout human history, over-indebted governments have chosen to inflate the debt away via money printing, which mostly resulted in currency debasement and hyper-inflation, with often dreadful economic and social consequences. A far more desirable avenue would be to grow the economy at a faster rate than public debt does since the increased tax revenues could help pay down the debt over time. As can be expected from a mature, developed economy, the US’s long term nominal GDP growth rate of 4-5% (2% real economic growth + 2-3% inflation) is below the recent budget deficits of 6-7% of GDP, so this avenue seems difficult to pursue, even with meaningful de-regulation initiatives, unless a major technological shift can bring productivity and economic growth at significantly higher levels. The Trump administration is betting that AI represents such a technological shift and is pulling all the stops to achieve dominance in that area, especially relative to China, whose government is also making substantial investments in AI technology. AI can boost economic growth in the near and medium term, as the infrastructure/data center buildup supports economic activity – we already see its impact in year-to-date GDP numbers. If the US succeeds in re-shoring a significant share of manufacturing activity via AI powered facilities, there would be substantial additional contributions to GDP growth in the medium term. In the long term though, while AI would bring large productivity gains, it could also make redundant a large percentage of the workforce, which would depress economic activity unless welfare programs like a universal basic income are enacted to replace consumers’ lost income (which means more fiscal spending and higher public debt). In a nutshell, betting on AI to boost economic growth is highly uncertain, but it’s likely the best shot we have at solving our debt and twin deficit problem. The AI push is portrayed as a race against China, probably to convince the American public to get with the program, but the real race is against the consequences of our past mistakes.
In recent weeks, doubts have started to emerge about the sustainability of what some analysts and commentators have called the “AI bubble”. Comparisons with the internet bubble of the late 90s, mostly based on valuation arguments, have led some to conclude that the AI trade may be on the verge of collapse. However, the words of John Maynard Keynes – the market can stay irrational longer than you can stay solvent – are especially relevant in the current context since there is a major difference between the current “AI bubble” and the tech bubble of 25 years ago. While the internet bubble of the late 1990s was essentially a private sector bubble, the current one is government sponsored. As a result, it can last longer and/or be of larger magnitude than what investors experienced back then, since the government’s involvement will likely lead investors to throw caution to the wind. A comparison of the US’s and China’s recent real estate bubbles highlights that point. In the US, the house price to income ratio started taking off in 1999 and peaked in early 2000 at less than 7x. By contrast, in China, the bubble started in earnest in 2009 and only peaked after COVID hit in 2020 with peak price-to-income ratios around 30x and even more in the largest Tier 1 cities. While the US government certainly intervened in the housing market (thereby contributing to the bubble and its collapse), the involvement of the central and local governments was much greater in China’s case, as real estate was considered a key engine of economic growth. Over there, it took an extraordinary event – the COVID pandemic and the related lockdowns – to finally break the crowd’s sentiment on real estate. In my view, the current extreme sentiment around AI is reminiscent of the early 18th century bubbles in companies dedicated to maritime trade like the South Sea company, since as is the case today, they combined state-sanctioned speculative ambition, technological promise, and strategic competition between nations. During the South Sea bubble, participating was seen as supportive of the country’s ambition, the government’s involvement helped lead investors to ignore risk concerns – especially the fact that the company couldn’t turn a profit – and the involvement of the elite of the time provided validation for the general public, all factors which contributed to inflating that bubble. While many prominent investors (including Isaac Newton) lost significant amounts of money, the South Sea bubble turned out to be just a bump in the road for the British empire, which continued its course towards global dominance. We’ll have to see if the AI race turns out similarly for the US.
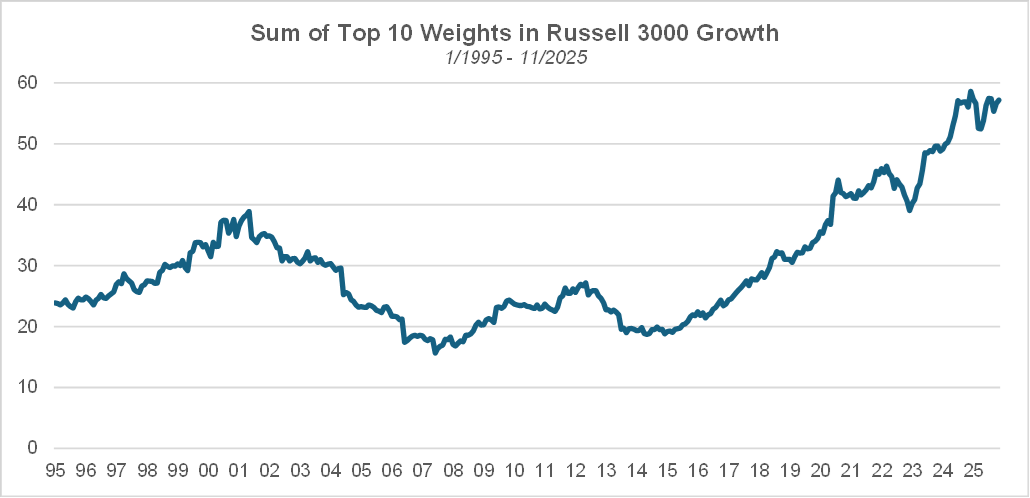
Getting back to comparisons between the current AI boom and the internet bubble, the current level of market cap concentration with the broader Russell 3000® Growth benchmark is much higher than it was at the peak of the internet bubble. The 10 largest weights in the index represent 57% of total weight as of November 2025 vs. 39% back then.
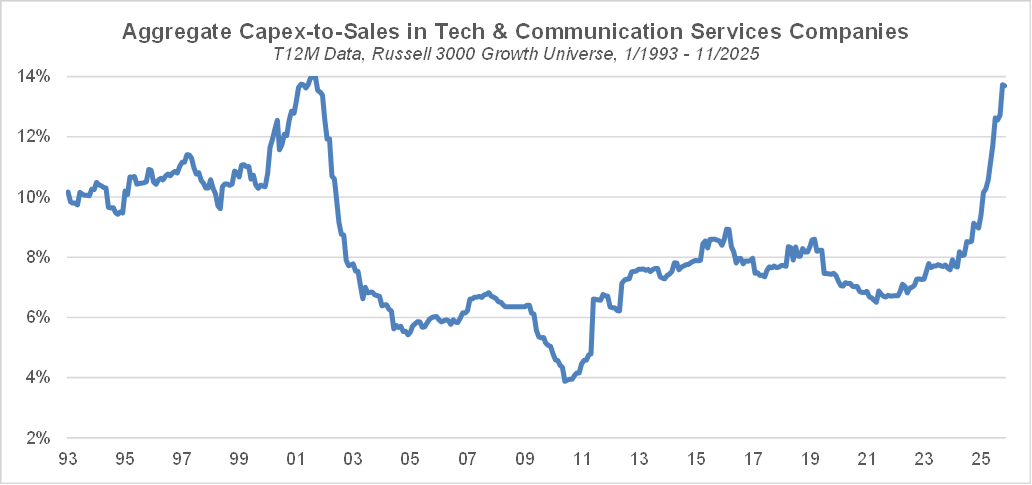
While much commentary has been made regarding the sustainability of AI capex spending, the aggregate capex-to-sales ratio for companies in the technology and communication services sectors, at 13.7%, is slightly below the peak of 14% reached during the tech bubble of 25 years ago.
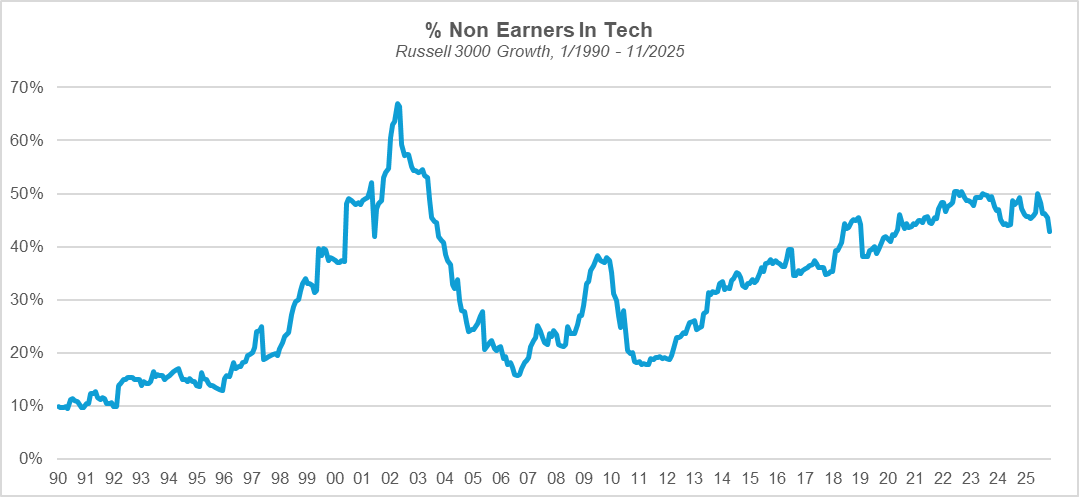
However, the percentage of non-earners (companies with negative net income over the past 12 months) in the tech sector so far in the current AI boom is much lower than it was at its peak in the aftermath of the internet bubble.
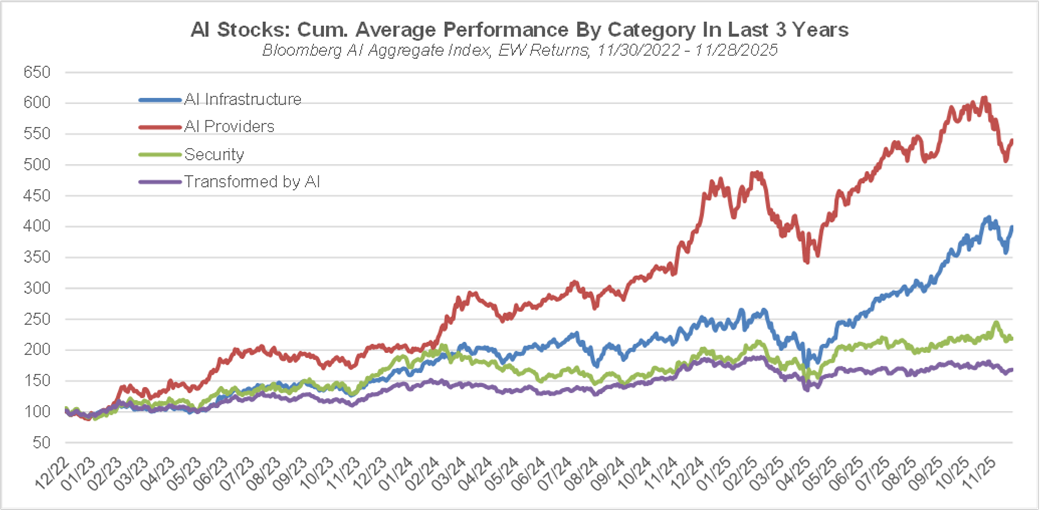
While the AI theme in aggregate has generated strong returns over the past 3 years, the tide has not lifted all boats to the same extent. With the help of ChatGPT, I categorized the 86 US listed constituents within the Bloomberg Artificial Intelligence Total Return Index into buckets according to a taxonomy we have created for our own AI portfolio. Companies in the AI infrastructure bucket provide the tools that make AI possible, like chips or coolant for data centers. AI providers are the ones who develop AI models and solutions. AI Security companies help their customers address the new security threats that have emerged because of the availability of AI tools. The “Transformed by AI” bucket corresponds to companies whose business is not related to AI but that are poised to benefit from the deployment of AI. As shown below, and consistent with our prior observations, AI providers have far outperformed other AI stocks over the past 3 years. AI infrastructure stocks (the proverbial “picks and shovels”) have also performed well. By contrast, the returns to AI security and transformed by AI companies have lagged materially.
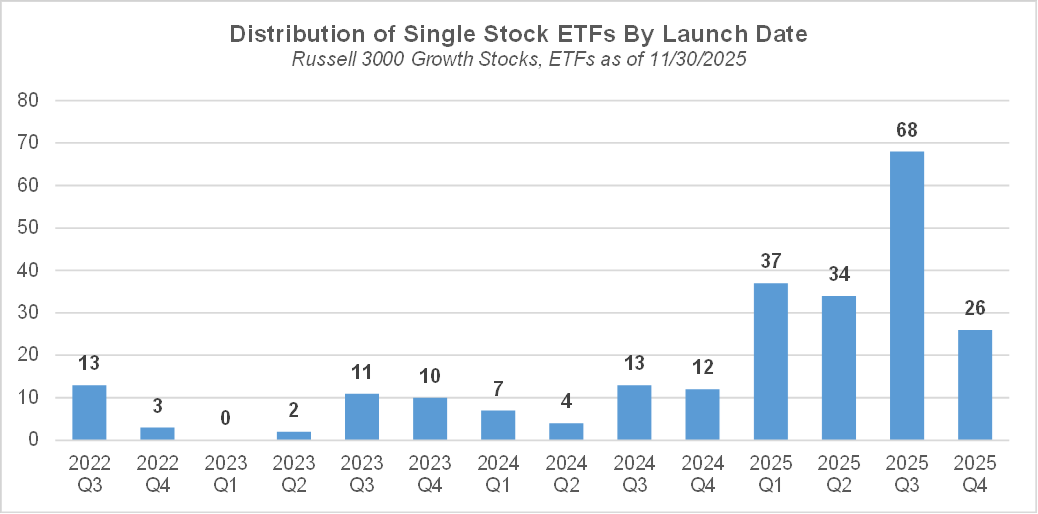
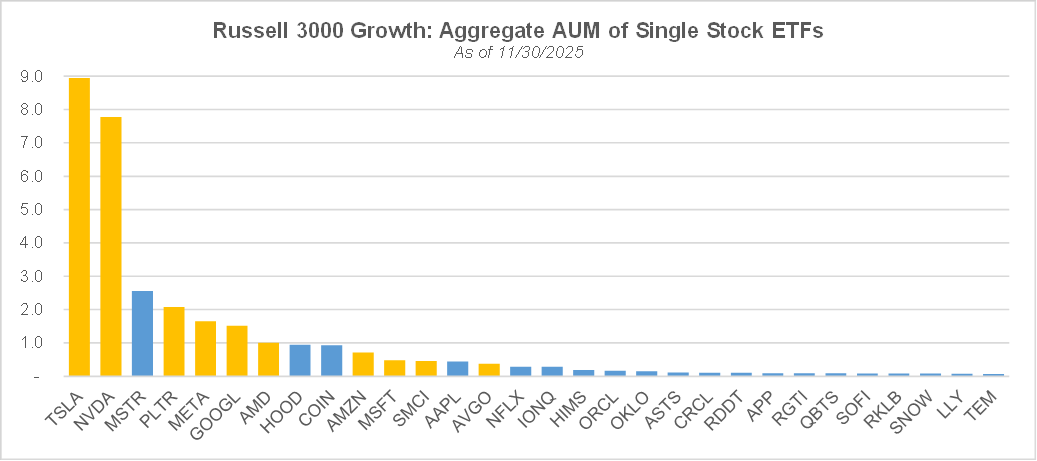
A noticeable development in the more recent episode of risk seeking investor sentiment is the accelerating pace of issuance of levered single stock ETFs, which provide yet another avenue for high octane speculative bets. The chart below shows that 68% of the single stock US ETFs whose underlying is one of the Russell 3000® Growth’s constituents and that are in existence as of the end of November 2025 have been issued in 2025.
In addition, most of the AUM in those single stock ETFs relate to stocks that have some connection with the AI theme, in particular TSLA, NVDA, PLTR, META, GOOGL, and AMD.
The AI boom has not just contributed to strong market returns over the past 3 years. Its impact has also been felt in aggregate economic activity in recent quarters, since the growth in capital expenditures related to the buildup of AI data centers has been high enough to generate a sizeable contribution to GDP growth despite AI capex having a relatively low weight in the economy: this year through the end of Q2, tech capex has contributed more to GDP growth than the whole of consumer spending, and it is one of the main engines behind the current upswing in the economic cycle. As government agencies in charge of producing economic statistics continue to grapple with the consequences of the shutdown, we still have a blurry and stale picture of the US economy. The KKT index, which we use to assess the current position of the economy in the business cycle, uses monthly industrial production and non-farm payrolls numbers as inputs, and the latest data point for both releases pertains to the month of September. Given that recent ADP payroll numbers and published data pertaining to the manufacturing sector have been weak overall, I ran an update of the index assuming zero payroll creation and zero growth in the industrial production index for the month of October. Based on those assumptions, the KKT index has increased slightly from 77.2% at the end of October to 79.2% at the end of November but is still consistent with the US economy moving out of recession. GDP has grown at a 3.8% annualized rate in Q2 and GDPNow expects 3.5% growth in Q3. It is plausible that the shutdown may have slowed down economic growth in Q4, but various measures included in the Big Beautiful Bill may lead to a reacceleration in Q1.
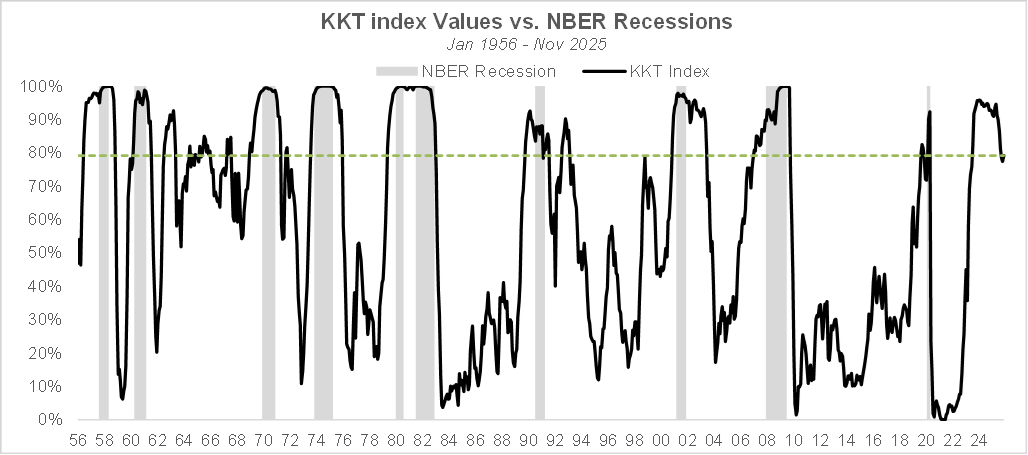
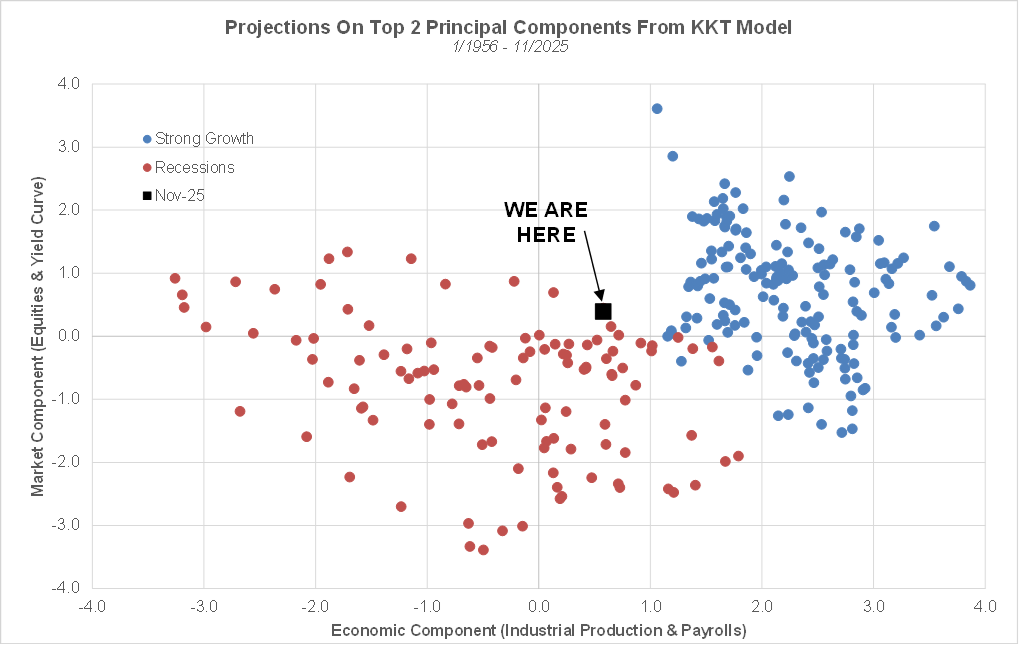
As mentioned in prior notes, the KKT index can be interpreted as a relative distance between current economic and market conditions and the average of such conditions during recessions vs. the average conditions during periods of robust economic expansion. Because the model includes 4 variables and our brains are not capable of handling a 4-dimensional space, we must perform some dimensionality reduction in order to visualize the relative position of current conditions. Running a principal components analysis on those 4 variables (using data since 1956) and retaining the top two components leads to a 2-D visualization that provides a reasonable approximation for the full 4-D picture, since the first and second principal components combined explain about 75% of total variance. The first component can be interpreted as a representation of economic conditions since most of its weight is on the industrial production and payroll variables. The second component, which puts most of its weight on the yield curve and market return variables, primarily represents market conditions. As can be expected, periods of strong economic growth (in blue) and recessions (in red) correspond to, respectively, favorable (unfavorable) economic and financial conditions, and the two regimes are clearly separated on the 2-D map. Current conditions are not yet in the robust growth zone but are at the edge of the recessionary red cloud of points, consistent with our judgement that the US economy is leaving recession/slowdown territory and entering an early cycle phase.
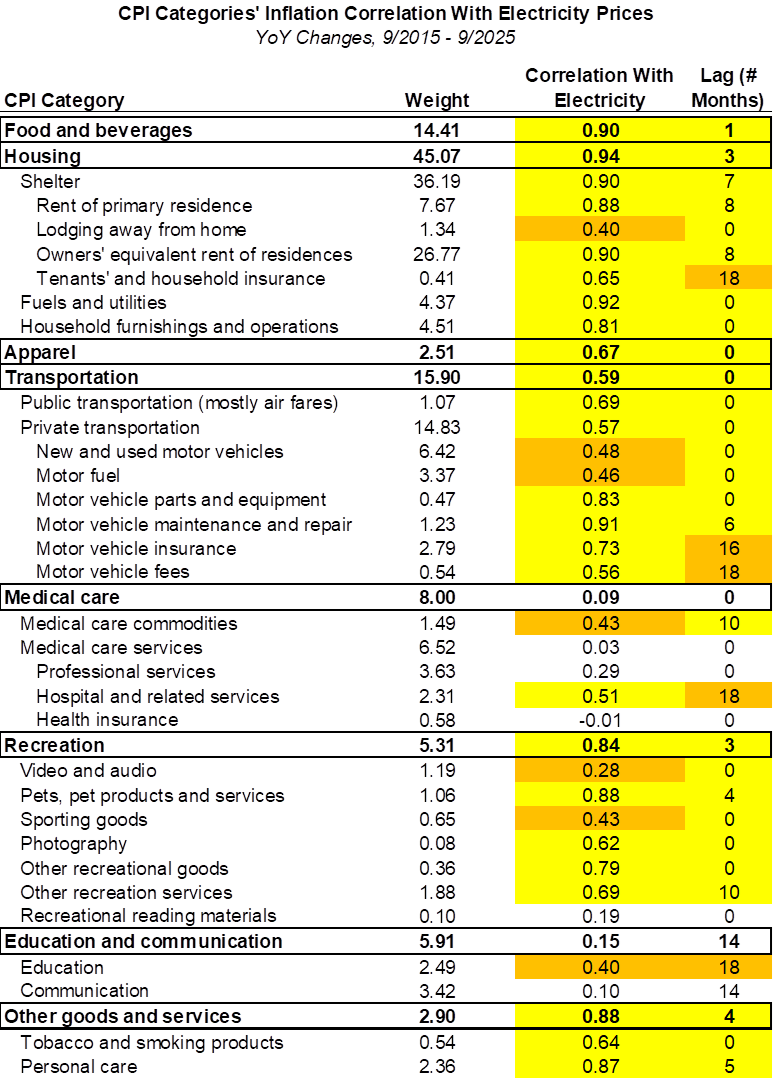
While in aggregate, GDP growth since Q2 has been relatively robust, perceptions about the state of the economy have been rather negative, with the University of Michigan consumer sentiment’s recent readings sitting near post GFC lows. Because of the K shaped nature of the economy (whereby a disproportionate share of economic gains accrues to top wealth holders and income earners), issues related to affordability and the cost of living have taken center stage and are starting to have political consequences, with the election of a far-left candidate as mayor of NYC and increasingly vocal complaints by figures in the MAGA movement that domestic (and especially economic) issues are not receiving enough attention from the Trump administration. The growth in demand for electricity by AI data centers adds more salt to those wounds, as consumers are facing significant hikes in their utility bills, not to mention potential brownouts as the grid may struggle to meet the increased demand. In addition, as shown in the table below, because electricity is a key input in the production of many products and services, electricity price inflation tends to be followed – in most cases with a lag of just a few months or less – by inflation in most components of the CPI. Therefore, the AI boom could indirectly be responsible for a resurgence in inflation. Besides encouraging solutions like behind the meter systems to avoid overburdening the grid and aiming to grow the supply of all domestic sources of energy to the maximum extent possible, an option to contain the rise in electricity prices in the US would be to build more data centers in allied countries – like the Gulf countries – with access to plenty of cheap energy. The bottom line is that the still-too-high inflation, which disproportionately impacts those who are left out of this bifurcated economy, is likely going to be a key topic in the months leading to the midterms. Over the past 20 years, the president’s party has been punished at the midterms, and there is no compelling reason to expect a different outcome in 2026: according to both Polymarket and Kalshi, the Democrats have a 75% chance of retaking the House. However, a severe defeat – which could become a real possibility if inflation re-accelerates next year – would make it much harder for the Trump administration to further pursue its ambitious agenda. In that regard, Trump seems to view a Fed chair who lowers rates as an asset – pun intended – but it could turn out to be a liability.
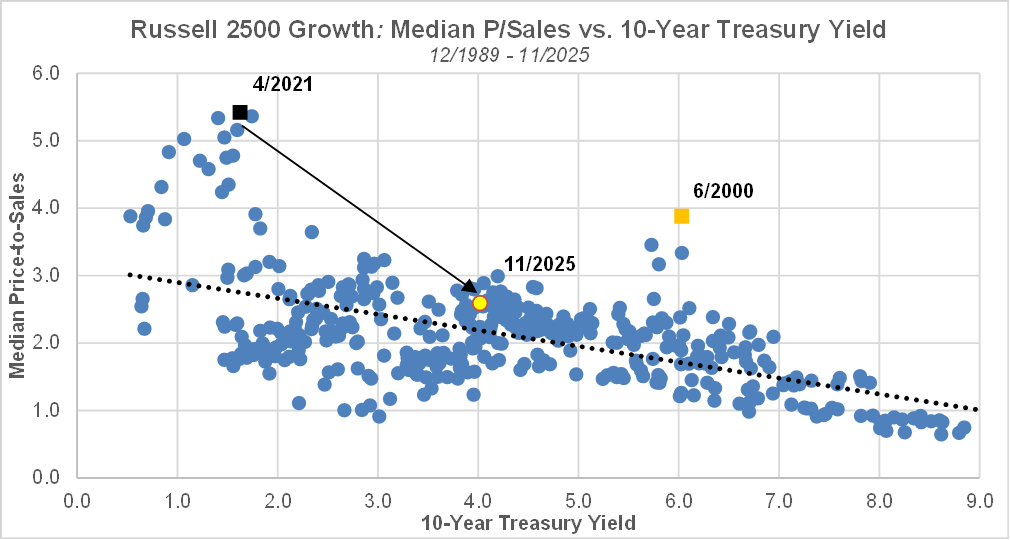
As we have mentioned repeatedly over the past few months, aggregate market valuations continue to be heavily skewed by a smaller number of mostly AI-related mega caps. However, the median valuation for small & mid cap growth stocks remains broadly consistent with the current level of the 10-year yield and is nowhere near the extremes reached in 6/2000 and 4/2021.
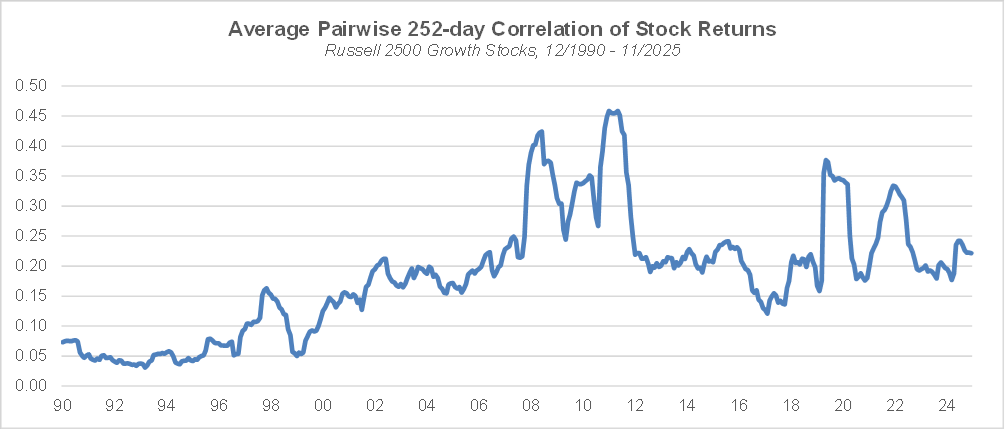
Our long-term measure of sentiment, the average pairwise correlation of stock returns, at 0.221 is right at the median of post GFC historical values, and nowhere close to the 0.158 level reached in 1/2020, much less the 0.05 low from 12/1999, also suggesting that investors’ risk seeking sentiment is not that extreme.
A key benefit from looking at the performance of quant factors is that they reveal insights into investors’ preferences. In particular, the performance of factors – like high vs. low volatility stocks – that are sensitive to macro regimes provides indications on investors’ sentiment and potentially their views on the state of the economy. After a very strong run since April, high volatility stocks have under-performed meaningfully last month, along with junk and most shorted stocks. By contrast, high quality, low volatility, least shorted stocks have outperformed.
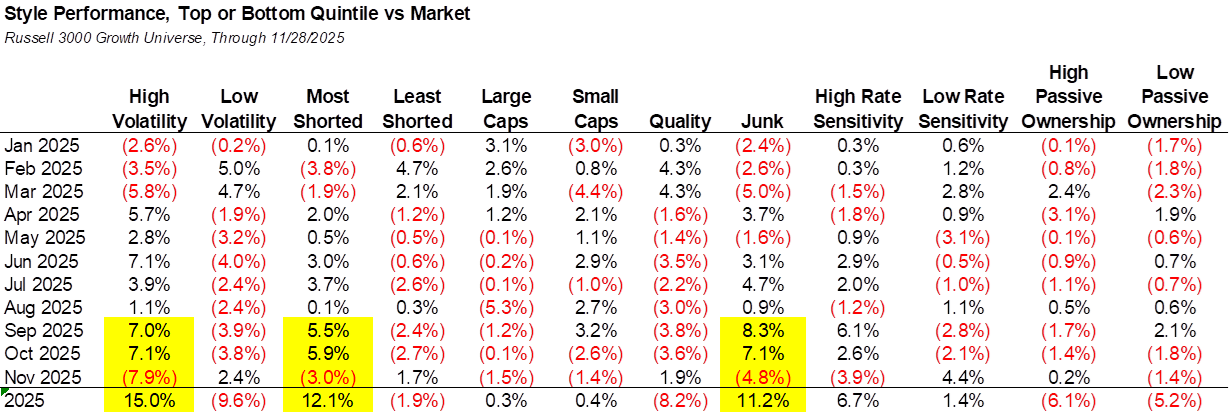
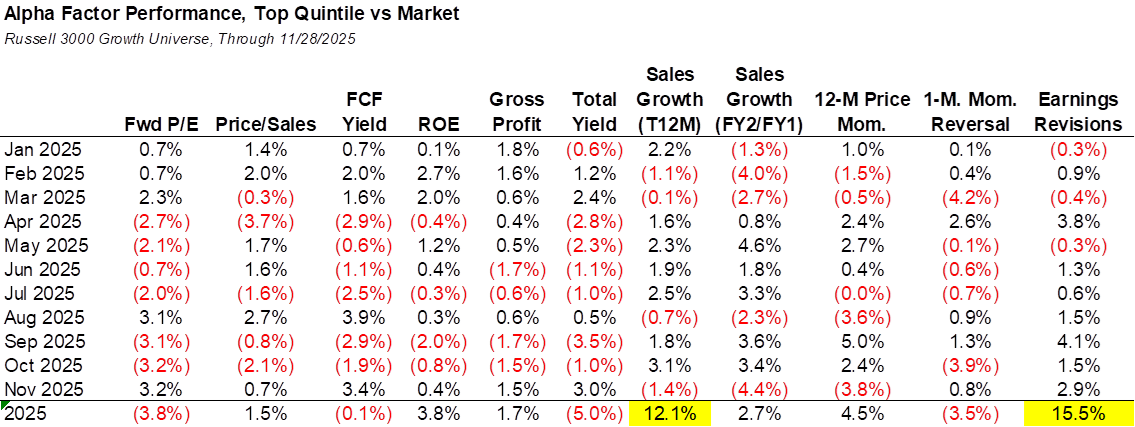
Within alpha factors, valuation, profitability, and yield have performed well last month, and earnings revisions has continued its strong run year to date, taking the title of factor of the year for now. By contrast, growth factors and price momentum have fared poorly, but trailing revenue growth still exhibits solid performance YTD.
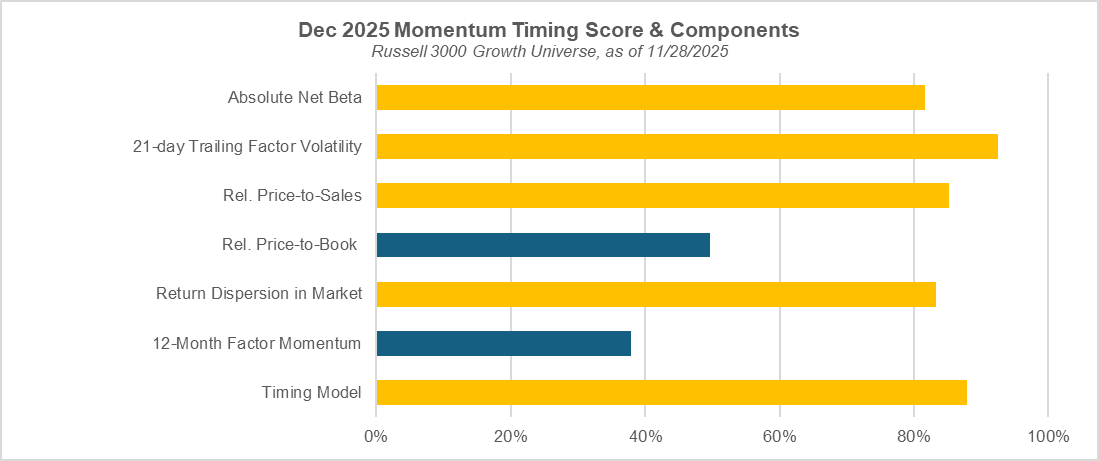
Our momentum timing model continues to indicate that high momentum stocks have a high probability of under-performing in December. The model’s indication is supported by 4 of the 6 underlying variables: the return dispersion within the market observed last month, the trailing 21-day momentum volatility, the absolute net beta of the momentum factor and the relative price-to-sales multiple of high momentum stocks. After a strong run since September, high momentum stocks underperformed materially last month, and the timing model indicates that more downside is to come.
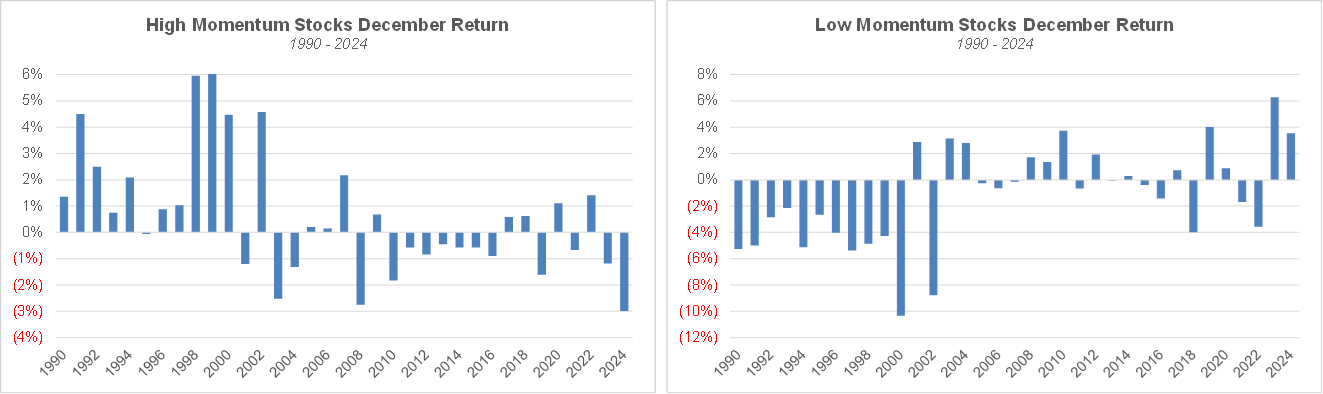
However, according to the empirical research literature, December has traditionally been a favorable month for the momentum factor, because of tax loss harvesting towards the end of the year, as investors hold on to their winners and sell their losing positions, providing more fuel to the momentum effect. In the Growth universe, we do observe that on average since 1990, the top quintile of price momentum has indeed outperformed in December while the bottom quintile has underperformed. However, as the chart below reveals, this average observation relies primarily on the data from the 1990s, and the pattern has become far less evident since.