Market Overview
While the pace of change didn’t seem to slow down in the third quarter of 2025, the market was apparently more resilient to the noise. Despite new tariff gyrations and grumblings between President Trump and the Federal Reserve, the market steadily marched higher, with only brief moments of volatility. The S&P 500® Index gained 8.12%.
The Fed finally felt compelled to deliver the cut to Fed Funds that the administration has been arguing for. Chairman Powell pointed to incrementally softer labor markets to justify the 25 basis point cut. The market wasn’t surprised at all, as equity markets appeared to have priced in that cut, plus two more by year’s end.
Continued enthusiasm about Artificial Intelligence spurred retail investors to pour money into the market. Curiously, investors were chasing exposure to gold at the same time. Oil was one of the few assets to finish the period at a lower level.
Outlook
This summer, I spent some time in Japan. One of the highlights was visiting the Sapporo Art Park. There’s an outdoor sculpture garden that is really quite fun and beautiful. If your travels ever take you to Hokkaido, I highly encourage you to go! One interesting feature is that it is very non-linear, and each of the sculptures are quite spaced out. It is easy to end up wandering around. In order to see everything, in a timely and efficient manner, you really need to follow the recommended path, but you really have to pay close attention to the map to take the prescribed route (see the little black arrows).

When I was there, there were more than a few times I wanted to see a map with a “YOU ARE HERE” indication with a big red arrow. Instead, I had to use the pictures of the sculptures as context clues to get my bearings and get back on track. I suppose this was part of the fun; it’s a feature, not a bug.
As someone focused on markets and the economy, it would certainly be nice to have something to refer to, with an obvious indication “YOU ARE HERE” in the business cycle. Of course, no such thing exists. But rarely, if you pay close enough attention to the contextual clues, you can get a sense of where we are. I think I may have found a tiny bit of clarity, if only for this moment.
Let me start by providing you these context clues. Some of these are things I’ve been saying for quite some time. Let’s start with my favorite – inflation. The first of my two relevant issues with inflation is my hypothesis that CPI and PCE understate actual, observed inflation for the average consumer. (For more detail, refer to my comments back in Q3 of 2024 here.) My argument is based on three factors. The hedonic adjustments made by the BLS are an important way of recognizing the impact of innovation and technological advancements in the things that comprise the market basket. For instance, if the newest iPhone has a much better camera than last year’s model, and the sales price is the same, then economists would conclude that there has been deflation in the price of a smartphone – it does more for the same price.
I won’t bore you with the math behind those calculations, other than to say they create a multi-factor regression model that tries to derive the portion of the total price to each feature of the good. I won’t argue with the math – it is what it is. Here’s my issue: these calculations convert today’s prices to yesterday’s technology and yesterday’s standard of living. The more innovation and more technological advancement we get, the faster the standard of living changes, and the more CPI understates actual inflation. I think we can all agree that we’ve been on an uninterrupted ramp of accelerating innovation which has really hooked up in the last few years.
Another source of inflation mismeasurement is the fact that the BLS has made some important changes to the calculation methodology over the years: home prices and interest costs are no longer directly considered, and there’s more allowance for substitution in the basket of goods. If we still used the methodology that was in place when inflation was rampant in the 1970s, the readings in the last few years would have been higher…much higher. An NBER paper written by Larry Summers and others estimates as much as 9 points higher at certain, recent times.
Clue #1 – While stated inflation has been high and problematic, it important to note that the actual cost of getting by in a world full of technological advancements and innovation and defined by a rapidly changing standard of living is probably meaningfully higher. This idea seems to conform with most consumers’ lived experiences.
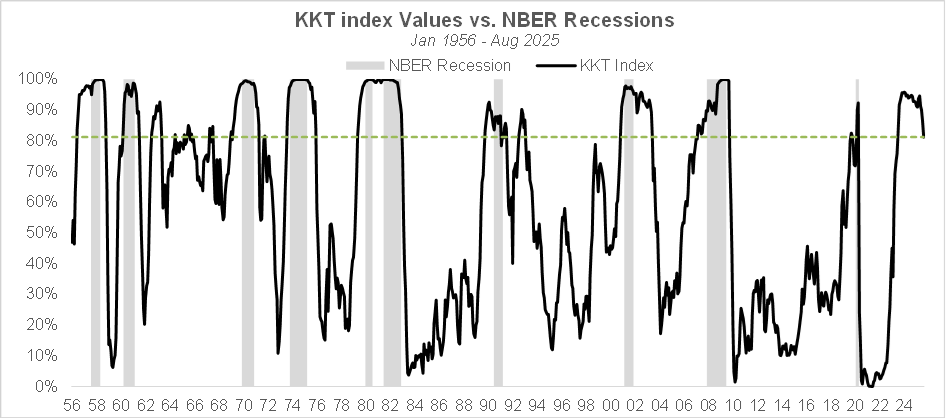
For a couple years now, and for a variety of reasons there’s been speculation of a recession. Again here, the average consumer has struggled. The rise in the price level has resulted in a real struggle. Our very own quant expert, Charles Clavel, has been using a framework described in this paper to analyze the business cycle. This KKT Index (named after the paper’s authors) seems to be a very reliable way of measuring whether or not we are in a recession. This metric entered recession territory starting in about Q4 of 2023.
I don’t know if this deserves to be its own clue or not, but when the BLS revised the job growth statistics for 2024 downward by 900,000 jobs, it only supports the notion that the economy was weaker than originally thought.
Clue #2 – Reliable economic models were indicating a recession up until very recently.
Recessions are generally defined as two consecutive quarters of negative real GDP growth. Real GDP is calculated by adjusting nominal GDP by the GDP deflator. It’s important to note that the GDP deflator is not the same calculation as CPI or PCE, but it ultimately is constrained by the same measurement limitations I described above.
If we reverted back to the same CPI calculations we used in the ‘70s, or even if we developed a new measure of inflation based on my proposed idea of measuring the cost of getting by in the modern world, those numbers would have been materially higher than the GDP deflator. Looking at recent official real GDP numbers, which have ranged from -0.6% to 3.6% in the last 7 quarters, if inflation is understated by as little as 2%, we were in a (at least a brief) recession. If it was understated by 3-4%, which is certainly conceivable in my opinion, then it was a legitimate recession, but a hidden one.
It’s an important distinction. I think it’s fairly obvious that spending patterns and behaviors for both consumers and businesses would suffer simply from being told that we were in a recession. There’s a strong negative feedback loop there. Without that in place, and no hysteria, no panic. We just quietly suffered through a brief period of decline.
Clue #3 – In my opinion we just went through a hidden recession.
If you’re reading this, you’re probably aware of our investment philosophy and process. Within it, we look for ways to exploit the underestimation of change in terms of magnitude of change (what we call “catalyst”) and in terms of duration of change (what we call “core”). The split between the two is a result of our bottom-up efforts, and we believe it is a powerful dynamic that allows the portfolio to shift as the economic conditions warrant. Over my entire career, we’ve noted that we tend to see a significant uptick in catalyst opportunities at cyclical bottoms. I believe it is at least a coincident indicator of economic activity, and in some cases has been a leading indicator.
In the last twelve months or so, if you’ve been reading this commentary, you probably remember me saying that we had seen an uptick in turnover and a disproportionate share of our new positions had been catalyst. I had been mostly attributing this phenomenon to AI-related opportunities, but maybe it’s something more.
Last quarter, we saw the largest spread between the performance of our core stocks and our catalyst stocks, in favor of catalyst, and across all of our investment strategies going back to the inception of this firm. The same is true for the trailing twelve-month period.
Clue #4 – Our internal processes around core and catalyst indicate that we may have just passed a cyclical bottom.
The undermeasurement of inflation means that we might have been in what I call a hidden recession up until as recently as mid-2025. Recent market action has favored momentum and shunned low volatility; this kind of factor performance is more indicative of an early cycle recovery. We might be in the early stages of emerging from a hidden recession.
It’s probably no surprise that the boom in generative AI is driving the economic growth. Imagine where we’d be without the breakthroughs in AI!
Without even attempting to measure the productivity improvements and other uses for AI, the first order effects of building AI infrastructure are massive on their own. The economy has been benefitting from this AI data center capex, but it is set to accelerate in a material fashion in the coming years.
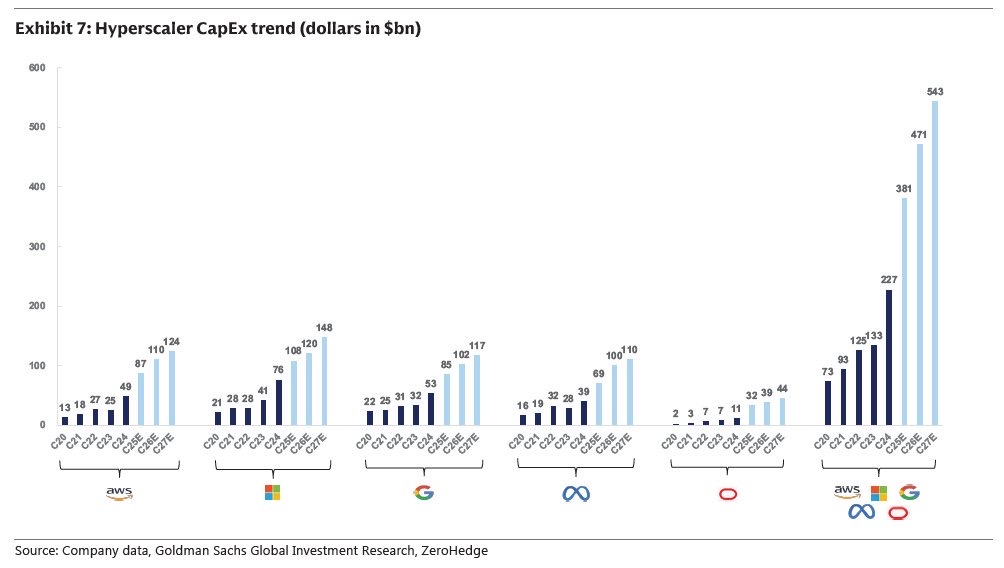
There were powerful network effects with Internet business models, and that’s why over the last 25 years we’ve seen these winner-take-all or winner-take-most business models. Today, the management teams of these hyperscale companies all believe that AI will be the same – winner-take-all. So, the logical conclusion is to do everything you can to be the winner. Full speed ahead. With every player using the same strategy, it seems likely that we will eventually overbuild AI compute capacity. But for now, they are spending money as quickly as they can.
I say, “as quickly as they can,” because it’s not as quickly as they want. Bottlenecks and constraints are everywhere. Initially, the constraints were about getting the GPUs and the hardware that goes inside the data center – and that is still the case. The bigger and looming issue is the ability to power the data center – electricity. (As a side note, I think these bottlenecks are a wonderful thing for investors; they will prevent over-building in the near term and effectively stabilize and lengthen the cycle).
AI capex is different than most other forms of spending. The multiplier effect on the economy is comparatively small for two reasons. First, AI data centers are employee-light. It’s nothing like a factory. Once an AI data center is up and running, it doesn’t add many jobs to the economy. The second difference is that much of the stuff that goes into a data center is very high margin. With nVidia’s and other’s gross margins in the 70% range, so much of the money spent on building an AI data center ends up on the balance sheets of companies like nVidia. With more traditional capex spending, there is an entire ecosystem of vendors and their component suppliers as well as raw materials producers and so on that benefit.
So, in addition to just looking at economic data points and market internals, there is a real and fundamental reason to believe that we may be at the early stages of an uptrend in the business cycle.
Not all data points are lining up, however. The jobs picture isn’t great. There is clearly a mismatch of supply and demand for certain skillsets across the labor market. Additionally, there is strong evidence that AI is causing what is at least frictional job loss. Historically around any major innovation, while there are always fears of structural unemployment, it has never played out that way. Is it different this time? It’s different every time. (And we haven’t even begun to talk about the impact of AI-fueled improvements in robotics!)
As I write this, we are in the midst of a government shutdown. It seems likely that there will be additional job losses at the government level. I think we should expect Q4 labor data to weaken even more. But this could be the last little bit of bad news before the good news starts to flow.
The Fed is pointing to these same weak labor markets as the reason for cutting rates. The accommodations have already begun with a rate cut in September, and what looks to be like two more cuts before the end of the year.
There are fiscal accommodations coming as well. The first is the tax relief from the OBBBA. Dan Clifton at Strategas estimates that we will see a 44% increase in Federal tax refunds in early 2026.
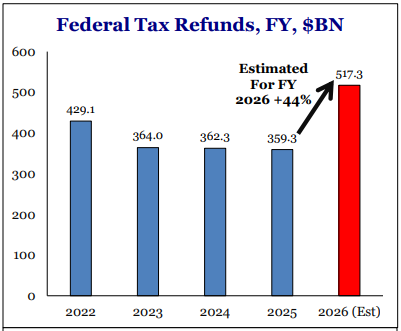 These refunds will mostly land in the hands of consumers with a high marginal propensity to consume, so we expect to see a lift in consumer spending.
Further into 2026, we expect to see more evidence of what SIMG’s own Portfolio Manager, John Keller, referred to as a “collision between the world’s fastest moving companies and the world’s slowest moving companies.” The slow ones are starting to act. The AI data center capex numbers are ramping now and having a direct and positive impact on the economy today, and that is set to accelerate. But what is yet to come is the wave of spending to build electricity generation and transmission required to power these data centers.
The final positive source of spending is the increase in domestic production. We believe that the Trump administration’s tariff policies are effectively incentivizing companies to invest in manufacturing here in the US. That’s yet another wave of spending yet to come, and with it, more jobs. Growth in power generation, manufacturing, and pharmaceutical production facilities should have a powerful multiplier effect – as other businesses (and with them, jobs) are needed to support these new facilities.
That’s all pretty straightforward: generative AI hit a major inflection point, and the world’s largest companies are racing to be the winner. The massive wave of spending on infrastructure is triggering a wave of spending in power generation. At the same time, more and more companies are moving means of production to the US, accelerating the manufacturing renaissance. It all fits together nicely.
What doesn’t fit quite as well, is understanding what’s happening across every asset class. Here’s where the picture becomes less clear. It’s a little weird to be at the early days of a cyclical recovery with the market near all-time highs, bitcoin near all-time highs, and gold going parabolic. That doesn’t fit with the other clues pointing to early cycle. In my map metaphor, we need to consider that there is at least one more dimension to our map: a dimension that reflects the value of the denominator to all these assets – the dollar. Once you take the inflation (or asset inflation) red pill, it makes more sense. It’s not the price of x going higher, it’s the purchasing power of the dollar going lower. That’s what they all have in common.
Early on in an economics curriculum, we are taught that inflation can come from demand-pull or cost-push. On the demand side of things, it often comes from too much liquidity or too many dollars chasing the same goods and services. In the COVID era, we had both (production was limited due to lockdowns, and people were flush with stimulus). When stimuli hit the economy (wealth transfers, tax cuts, or other windfalls), that new money often gets spent, bidding up the prices of things in the economy. But this doesn’t happen in a uniform fashion. For instance, I’m fortunate enough to be at a point in my career (or old enough), that my income covers the lifestyle and spending patterns I want. If I get an unexpected tax break or some windfall, it doesn’t really change my consumption pattern. For me, that extra money will essentially go into some savings or investments (alongside of our clients, of course!). In economics terminology, my marginal propensity to consume (MPC) is essentially zero. It is reasonable to think that there is some level of income or wealth above which MPC is very low or zero.
When excess liquidity flows to people below this threshold, those with an MPC closer to 1, there is a powerful multiplier effect on the aggregate demand. The stimulus checks and PPP loans during COVID were perfect examples of this. That money got spent very quickly, contributing to the spike in CPI. I would argue that when excess liquidity flows to people above the threshold, there is almost no multiplier effect and no pressure on CPI. That money needs to go somewhere though, so instead it ends up in stocks, bonds, real estate, gold, crypto, and other assets. I have argued before that the very loose monetary policies post-GFC of near zero rates and QE mostly accrued to those above the threshold. We saw massive asset inflation, but very low measured inflation.
Now, all things being equal, advancements in AI and other technologies should be very deflationary. But remember, one of the two stated mandates of the Federal Reserve is price stability. Central bankers really fear deflation (perhaps more than they should, but that’s a discussion for another day). Ask yourself this: if all the wonders of AI and innovation are deflationary, and the central bank believes deflation is a terrible thing and their job is to target 2% inflation, then just how accommodative does monetary policy need to be in order to offset the deflationary impact of innovation? I think the answer is that it will need to be very accommodative.
And the accommodation is coming – and the Fed is clearly broadcasting this now. Then just like in the post-GFC era, I think it is likely that we will see continued asset inflation. I believe that this is a key driver behind the k-shaped recoveries. If you own enough assets, then you benefit from the asset inflation, and inflation (both the asset inflation and actual inflation) are a net benefit to you. But if you don’t own any assets or enough assets, then inflation is a nightmare. This isn’t new, and it looks set to continue or even accelerate.
The US isn’t the only country ramping accommodations. It’s a global phenomenon. And once you swallow this inflation pill, if you believe it will continue, then you quickly come to the conclusion that you need to own assets and not fiat currency. Just like economists worry about a wage-price spiral, maybe we should be worried about a fiat-asset spiral. I’m not certain that’s what this is, but that narrative is gaining steam. Post-GFC, Jason Trennert at Strategas coined the acronym TINA – There Is No Alternative, meaning there is no alternative to equities, because yields were so low that they weren’t worth investing in. TINA might be alive and well again, not because nominal yields are so low, but that the dollar is an unacceptable store of value. I’m not saying this is the case today or will be the case, but this narrative and line of thinking is gaining steam, and in my opinion is part of the reason for the performance of all these asset classes.
Gold is telling us that something has changed. Years ago, my concerns on this asset inflation problem were usually dismissed by most economists and market pundits. Today, it’s not just the so-called gold bugs that are talking about this. The narrative is gaining momentum.
There’s another issue that doesn’t quite fit the early-cycle narrative. It could be nothing, but it might be a serious and confounding data point. There have been some credit problems. Tricolor, a sub-prime auto lender, unexpectedly filed for bankruptcy in September. While there’s an ongoing investigation into what went wrong, the early reports are that there was serious fraud by pledging the same car as collateral many times over. In my opinion, it wasn’t the fraud alone that caused the failure, it was an inflection point in collections that revealed the fraud. Taken by itself, one could easily dismiss this as a one-off matter. More recently, First Brands, an auto part supplier, went bankrupt as well. On top of that, as I write this there have been some surprising write-offs at some large banks.
Being the cynic that I am, I would assume that the recent influx of assets into the private credit space has probably led to situations where investors loosened their due diligence and underwriting standards in order to meet the demand. But I honestly have no idea if these things are connected. We are watching this space closely. If it’s idiosyncratic, so be it. If it’s not, then this is a strong piece of evidence that we are not early cycle. Let’s watch this closely.
Where are we? In Sapporo, my reference points were statues and sculptures that were fixed in time and place. Our problem is that the landmarks on our metaphorical map are also changing. It’s hard to fully wrap your mind around all the implications of having the basis in which all things are measured (the dollar) to experience significant change. Coincidentally, there’s a parallel for this in our business, as our benchmarks have been changing and taking on unusual characteristics lately – but that’s a story for another day.
Too Long; Didn’t Read? In my estimation, YOU ARE HERE: The early stage of emerging from a recession which was hidden by underreported inflation, fueled today by spending on AI data centers and early AI-driven productivity improvements, and extended by the coming spending wave on new power generation and transmission, and a resurgence in domestic manufacturing incentivized by recently introduced tariffs and national strategic initiatives. All the while, the insidious impact of mis-measured inflation is making nominal returns look amazing, and this trend shows no signs of slowing.
As much as I love to ponder the macro condition and where we are headed, it’s more fun to focus on the most exciting thing we do as a firm – seek out and exploit the underestimation of fundamental, secular change. There’s so much of it now. It’s truly exciting. I think I can now say that we are entering the second inning of AI. We are going from speculating about what AI might do for us, to now seeing disruption firsthand. The advancements in text-to-video generation have been astounding. The impending disruption to the entertainment and advertising industries will be like nothing we’ve seen before. And that’s just one application.