“The dollar is our currency, but it’s your problem.”
Treasury Secretary John Connally, 1971.
Over the past few months, there has been an increasing amount of commentary about the stock market, and especially the AI theme, being in a bubble. The record high market valuations along with the seeming disconnect between the strong market returns and the weak macro data – especially metrics related to the job market – seem to justify this opinion. However, for those who have experienced the internet bubble from 25 years ago, the bubble narrative doesn’t seem to apply to the current context. Back in 1999/2000, you could feel the optimism in the air. The University of Michigan’s consumer confidence index was hovering near 110 and finding a job was easy, especially if you had a modicum of knowledge about HTML or the internet in general. Fast forward to today, social mood is undoubtedly negative. Consumer confidence is in recession territory, and college students – even from top schools – have a tough time finding a job. So, what gives? A casual observation of the price action of various assets shows that all risk assets seem to be rising in tandem, suggesting that the reason equities are going up is not so much that the economy is growing strongly but rather that investors fear monetary debasement. If that is indeed the case, what is happening is not a market bubble, but instead the beginning of a process whereby investors are losing confidence in the government. In that context, it would make sense for real assets like stocks or precious metals to go up as investors try to preserve whatever capital they have. Even the recent robust retail sales wouldn’t be that surprising in that scenario, since it would be better to purchase things that can be useful or enjoyable rather than leave the money in a bank account and watch it turn into dust. When equity market prices are expressed in gold terms rather than in dollars, a vastly different picture emerges. The chart below shows that back in 1999/2000, the Russell 3000® Growth was still in a bubble when expressed in gold terms, but not so now. Since 2021, the broader growth benchmark is still in a bear market in gold terms.
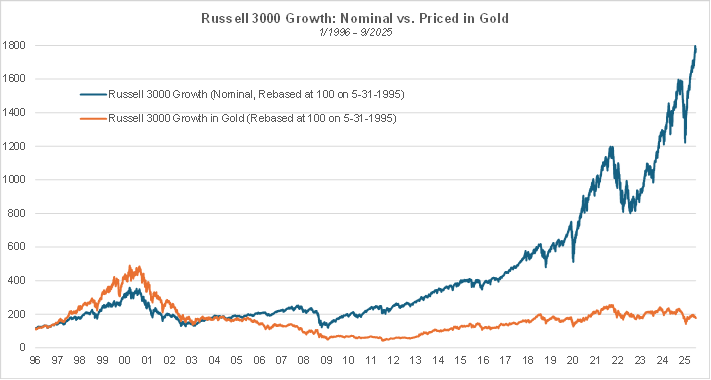
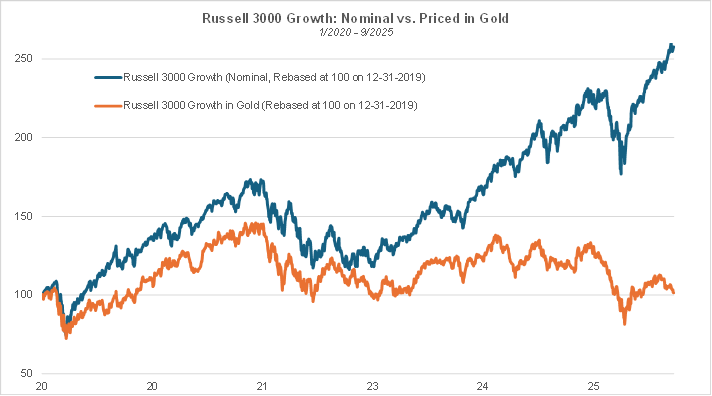
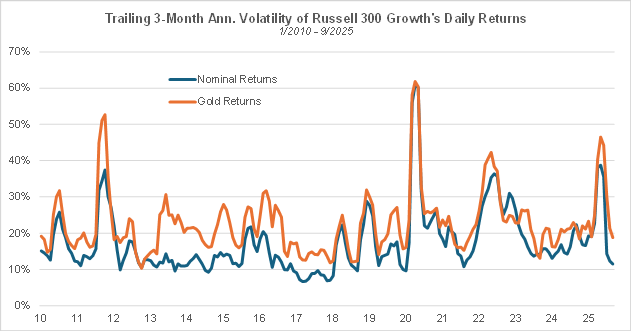
In addition, market return volatility in gold terms is not as low as that of nominal returns, since both market volatility and gold returns’ volatility contribute to the overall volatility of the market expressed in gold terms, suggesting that investors may not be as fearless as it might appear.
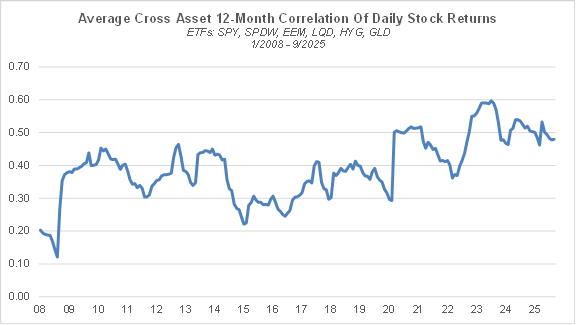
Another indicator of investors’ concerns regarding currency debasement is the high return correlation between private sector assets that are most likely to offer protection against such currency debasement, which suggests that the primary motive behind investors’ decisions is to preserve the purchasing power of their capital. The return correlation between those assets, which has risen significantly since 2022, hovers near historical highs. The average cross-asset correlations shown below are based on US ETFs representing major asset classes: SPY (S&P 500®), SPDW (developed markets ex. US equities), EEM (emerging markets equities), LQD (investment grade corporate bonds), HYG (high yield corporate bonds), and GLD (Gold), and are based on trailing 252-day periods.
Questioning the standing of the US dollar is often met with outrage or ridicule. Over the years, many dollar “doomers” have made predictions on the dollar’s demise that didn’t pan out. At the same time, the longer the dollar remains the world’s reserve currency, the more it emboldens politicians to take advantage of this “exorbitant privilege”, by embarking on excessive fiscal spending – for example, the “guns and butter” policy by President Johnson – or by weaponizing access to the US dollar through economic sanctions against countries that oppose our foreign policy. Unfortunately, history teaches us that a currency’s reserve status doesn’t last forever, precisely because of such government abuse. The “guns and butter” policy mentioned above eroded foreigners’ confidence in the Bretton Woods monetary system (whereby the dollar was deemed “as good as gold”) to the point when President Nixon had to suspend the convertibility of the dollar into gold in August 1971. Following that “Nixon shock,” the dollar did experience a meaningful decline against other major foreign currencies but retained its reserve currency status. Back then, the US was still a manufacturing powerhouse, had little debt/deficits, and enjoyed a fast-growing domestic consumer market as the large boomer generation entered adulthood. In summary, it was not dependent on the rest of the world to sustain its economy. The tough words above by Treasury Secretary Connally may have dismayed European and Japanese officials, but they conveyed the idea that the US was prioritizing its domestic interests over the potential impacts on global finance and trade.
Since then, the shift to a globalized economic order has changed everything. The terms of the deal were devilishly simple and appealing. The US ensures the (quasi) free flowing of capital, goods and people, and gets cheap goods and services provided by foreigners in exchange for dollars we can create out of thin air. In return, the rest of the world gets to use those dollars to save and invest. The key thing the US must do though is use its military might to ensure that no rogue regime disrupts global supply chains or challenges the dollar’s reserve currency status. What’s not to like? However, as Shakespeare told us, he who sups with the devil should have a long spoon. Over the last 40 years, we have fully embraced that Faustian bargain, thinking we would keep the cool stuff (technological innovation, design, marketing etc…) for ourselves and leave the dirty work to foreigners. As a result, while a relatively small, educated elite has benefited tremendously from globalization, millions of Americans have been left by the roadside and participate in the economy only marginally, causing major social issues that governments since Reagan tried to paper over with various welfare programs. The last four decades may have been a golden age for consumers who were able to access a larger than ever variety of goods at bargain prices, but on the flipside, the ballooning twin deficits – budget and current account, currently ~11% of GDP – put us in such a vulnerable position that it becomes very difficult to break away from globalization in an orderly fashion.
Since taking office, Trump has been attempting to reverse the damage caused by globalization by reshaping the terms of trade in the US’s favor, imposing higher tariffs on foreign goods and negotiating substantial investments in the US and purchases of US goods. While the idea does make sense, its execution has been far from flawless. His tariff policy seems overly complex, with a myriad of country/industry specific rates and on-the-fly exemptions and it appears to be changing by the day. Besides, the administration’s apparent desire to reduce our involvement in the world’s affairs casts doubts about our commitment to maintain geopolitical stability. As a result, many of our trading partners are trying to diversify away from the US dollar and some are even working on potential alternatives to the current dollar based monetary system. What is even more concerning is that the administration seems to rely solely on tariffs to restore both our fiscal position and our manufacturing base. DOGE’s efforts to cut government spending have quickly gone nowhere, as they have been met with significant backlash. Besides, another issue that doesn’t receive much attention is that we will not be able to grow our manufacturing sector without engineers, which currently are in short supply – the US mints half as many engineers as Russia despite having more than twice the population. If we want to increase the number of engineers while maintaining a restrictive immigration policy, we will have to significantly upgrade our schools’ math and science curricula. In addition, it will be critical to encourage young Americans to pursue a STEM education. In that regard, popular culture could help by portraying engineers and scientists as role models our young would aspire to become, rather than rehashing the same tired stereotypes about socially awkward nerds who can’t get a date. Now to keep some perspective, there could be more method in the administration’s madness than it appears. So far, tariff revenues at ~ 30 Bn per month can offset a nontrivial portion of our budget deficit. The recent achievements by TSMC’s fab in Arizona shows that the US (with the help of our allies in Taiwan) can achieve excellence in manufacturing. We still have a long way to go before reaching a dollar collapse and Weimar style hyperinflation, but the trajectory of the gold price should represent an urgent warning. The number one mission of the administration should be to ensure that we decisively get off that path.
In the short term though, the depreciation of the US dollar versus other major currencies is not such a bad thing for the US economy. Like in 2009/2010 when the decline in the US dollar that coincided with Bernanke’s loose monetary policy led to a rebound in exports and thus economic growth, the current decline is certainly helping the economy rebound from the slowdown or recession that likely occurred last year and earlier this year. The KKT index, which aims to measure the proximity of current economic conditions to recessions vs periods of strong economic growth, has dropped further to 78.4, an observation that is consistent with the economy rebounding from a recession/slowdown. GDP growth in Q2 has been upwardly revised to +3.8% and GDPNow – which for some reason the 2024 vibecession/2025 recession crowd has stopped mentioning – forecasts +3.8% growth for Q3 as well. Recent robust auto sales data also suggest that the economy is rebounding. The glass half empty cohort may point to the poor state of the job market and recent high-profile bankruptcies (Tricolor, First Brands) but those tend to be lagging indicators, as was the case for negative payroll numbers and regional bank failures in 2009/10.
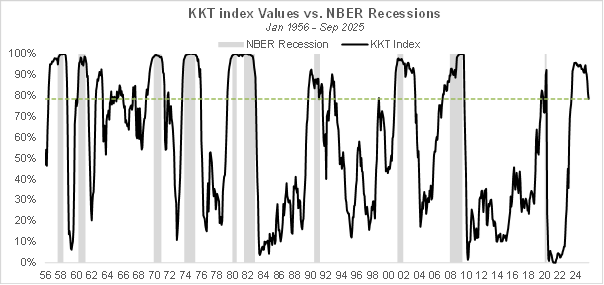
The methodology behind the KKT model is explained in the research paper below:
A NEW INDEX OF THE BUSINESS CYCLE by William Kinlaw, Mark Kritzman, and David Turkington
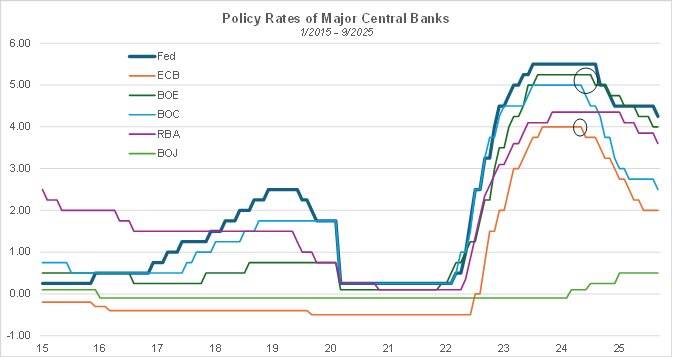
The latest FOMC meeting went pretty much as expected. Given the 2018 precedent, it was conceivable that Jay Powell would cave to the intense political pressure he was facing from the administration and make a 50-bps cut to pre-empt economic weakness that was conveyed by the latest payroll numbers, but he opted instead for a widely expected 25 bps “risk management” cut. As a chairman on his way out, he probably doesn’t want to rock the boat. In the current monetary policy cycle, it appears the Fed is behind the curve compared to the ECB, which has been able to get back to the 2% inflation target. To Jay Powell’s defense, there seems to be a US specific issue with inflation remaining well above target despite tight monetary policy, but in the current fiscal dominance regime, the likely culprit is excessive government spending. By keeping rates at a relatively high level, he can avoid being blamed for a potential resurgence in inflation that wouldn’t be his fault.
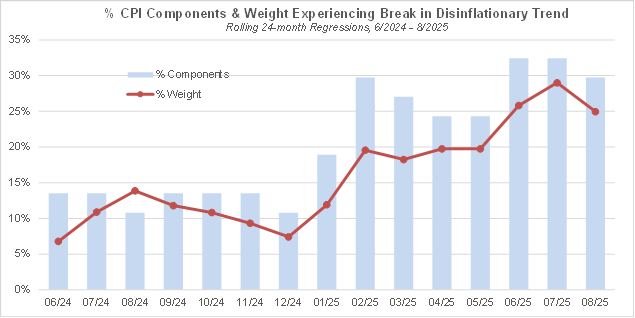
So far this year, inflation has remained in-check, even though core inflation remains meaningfully above the Fed’s target. In last month’s note, we introduced analysis to gauge whether inflation was inflecting upward in various subcomponents of the CPI. We observed that the number of components (and their associated aggregate weight in the CPI) have been on an uptrend since the middle of 2024. Updating the analysis with the August release of CPI numbers shows that the breadth of components experiencing inflation acceleration has experienced a modest drop that doesn’t invalidate the overall trend. We’ll keep updating this analysis monthly to identify whether more components of the CPI experience acceleration in inflation.
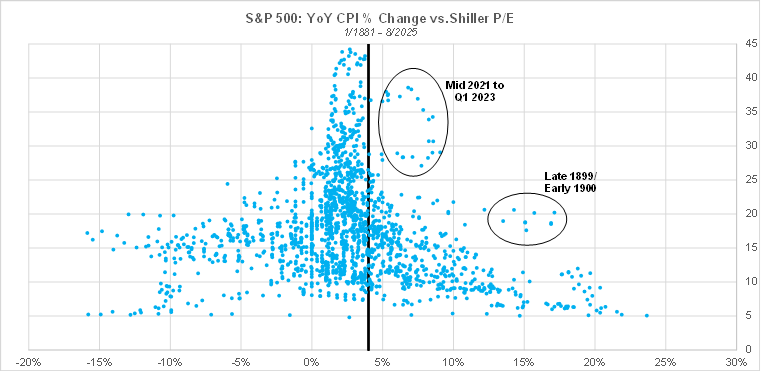
Historically, there has been an inverted U-shaped relationship between inflation and the market’s valuation multiple. Episodes of extreme deflation or inflation can be very detrimental to economic growth, and equities typically trade at a low multiple during those periods. The sweet spot with the highest market multiples (in terms of long term cyclically adjusted P/E) corresponds to CPI inflation between 1 and 4%. The current inflation rate (at near 3%) thus remains consistent with the market’s record valuations. However, should inflation accelerate past 4%, the market could very well experience a meaningful correction that would bring the overall multiple in line with the higher inflation rate.
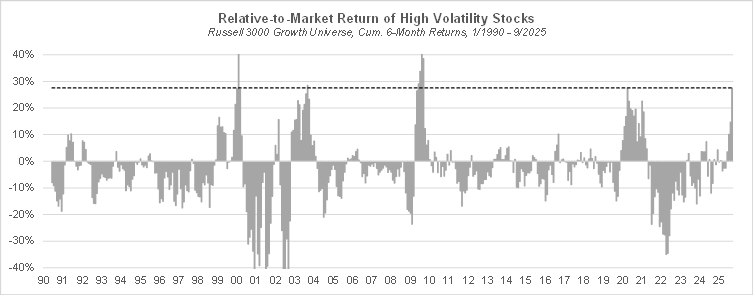
A key benefit from looking at the performance of quant factors is that they reveal insights into investors’ preferences. In particular, the performance of factors – like high vs. low volatility stocks – that are sensitive to macro regimes provides indications on investors’ sentiment and consequently their views on the state of the economy. Since April, high volatility stocks have strongly and consistently outperformed (high volatility is by far the best performing style cohort year-to-date), while low volatility stocks have underperformed, and the same pattern is observed regarding high vs. low quality stocks. In recent history, such return patterns have been observed when the economy is in a recovery phase of the economic cycle.
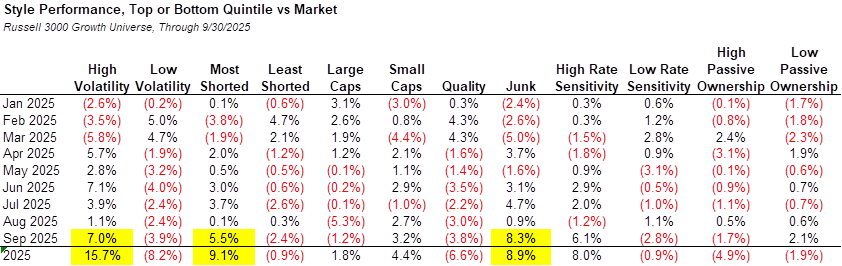
Relative to history since 1990, the cumulative 6-month relative performance by high volatility stocks is in the 98th percentile and is even higher in magnitude than what was observed in 2020 when extraordinary COVID stimulus measures were enacted. Other instances of strong high-volatility stock outperformance include H1 2009 and H1 2003, as the economy was recovering from a recession, but also late 1999/early 2000, at the peak of the internet bubble. I believe the balance of data evidence leans towards the current situation being closer to an economic recovery than the peak of a bubble.
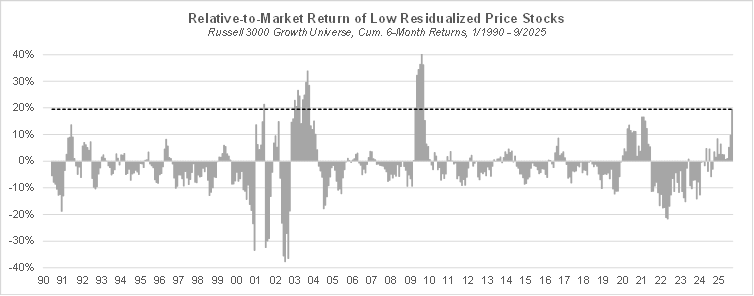
Another salient feature of investor behavior in recent months has been the remarkably high positive sentiment among retail investors. The latest (October 2nd) data from the American Association of Individual Investors show that nearly 43% of individual investors are bullish, a number that is in the 70th percentile of history since July 1987. We don’t have access to a data source that would indicate what stocks are the most popular among retail investors, but we can find a proxy by looking at the raw stock price i.e. unadjusted for splits and other corporate actions, with the assumption that retail investors would favor low price stocks given the relatively small amounts they have at their disposal to invest, even though this assumption is certainly less valid since fractional share trading has been popularized by online brokers since late 2019/early 2020. Given that stock price and market cap tend to be positively correlated, the analysis below is based on the residual stock price obtained by running monthly cross-sectional regressions of stock prices vs. market caps to isolate a stock price effect that is uncorrelated with the size effect. The chart below shows that stocks with a low price (after removing the impact of market cap) have strongly outperformed in the last 6 months, which we can interpret as an indication of robust retail investor activity. The outperformance by low price stocks in the last 6 months is even higher than what was observed in early 2021, in the heat of the meme stock mania.
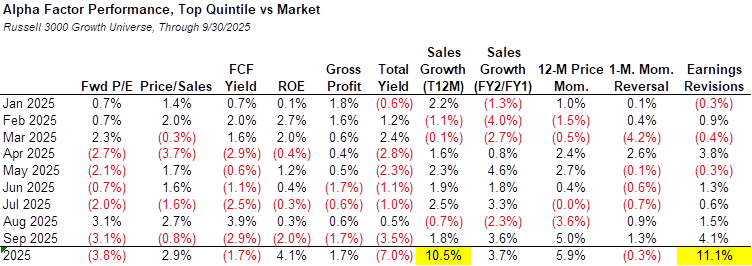
Within alpha factors, stocks with high price momentum or strong earnings revisions outperformed strongly last month, and those with robust trailing or expected revenue growth have also done well. By contrast, stocks with low valuation multiples or high profitability ratios have done poorly. Year-to-date, stocks with high earnings revisions or trailing revenue growth have been the best performers with shallow drawdowns, highlighting investors’ preference for companies exhibiting consistent growth in revenues and earnings in the current, uncertain, macro environment.
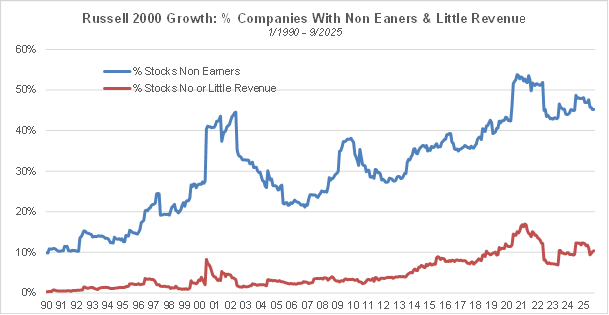
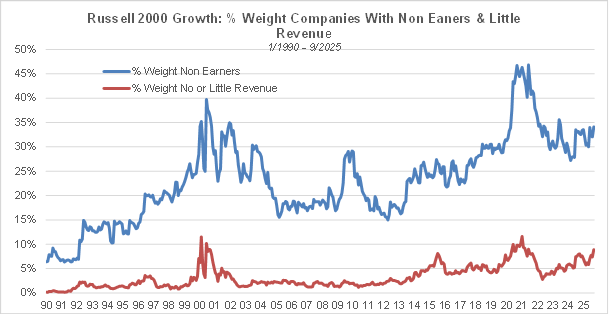
Yet another indication of investors’ optimism is the rising prevalence, in terms of both number of stocks and aggregate weight, of companies with negative earnings (defined as negative GAAP net income over the past 12 months) and negligible revenues (defined as less than 1% of market cap) within market benchmarks, and more specifically small cap focused ones. As shown below, the number of companies with negative earnings or negligible revenues and their aggregate weight in the Russell 2000® Growth have been on a rising trend since the mid-2000s. The increasing popularity of passive investing has certainly contributed to that trend, since, by definition, those investors buy the whole index and do not discriminate between stocks based on fundamentals. As of the end of September, over 45% of companies in the Russell 2000® Growth are non-earners and over 10% of them have no or insignificant revenues, and those represent, respectively, ~34% and ~9% of the index. Case in point, the largest quantum computing companies (IonQ, Quantum Computing Inc, D-Wave, Rigetti), which are essentially just long-term research projects at this point, make up 2.5% of the index, with IonQ being the 3rd largest holding. The increasing prevalence of companies with unproven business models or poor fundamentals may make it easier for fundamental managers to beat the benchmark in the long run but it leaves them vulnerable to shifts in investor sentiment, with their portfolios being exposed to the risk of significant relative performance drawdowns during “risk on” regimes.
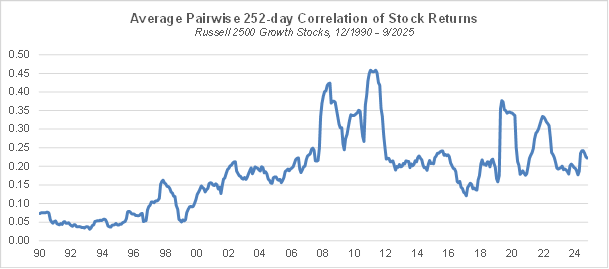
Our long-term measure of sentiment though, the average pairwise correlation of stock returns, at 0.222 is right at the median of post GFC historical values, and nowhere close to the 0.158 level reached in 1/2020, much less the 0.05 low from 12/1999, suggesting that investors’ risk seeking sentiment is not that extreme. In the short term, the VIX index is at rather low levels (~16 as of 9/30) but also far from extremes.
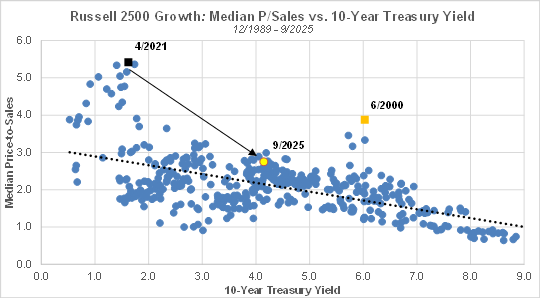
Median valuations for small & mid cap growth stocks have not changed substantially since last month. In that space, the median price-to-sales indicates only moderate over-valuation given the current level of the 10-year yield but is nowhere near the extremes reached in 6/2000 and 4/2021.
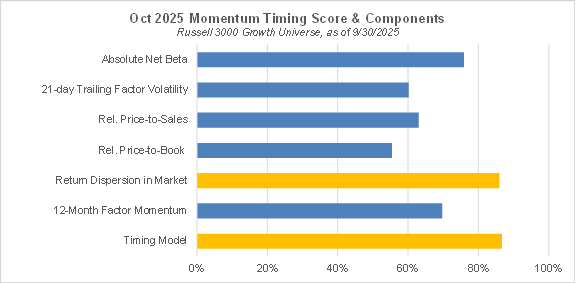
Our momentum timing model continues to indicate that high momentum stocks have a high probability of under-performing in October, but the model’s indication is supported by only one of the underlying variables, the return dispersion within the market observed last month, which has been high relative to history.