The following contains a brief discussion of the equity markets from Senior Quantitative Analyst, Charles Clavel, CFA.
For about as long as I have been alive, America has been concerned about its national debt. Since the US went off the gold standard in 1971, the country has been running budget deficits pretty much every year (which is probably not a coincidence), with a brief exception in the late 1990s, towards the peak of the tech bubble. Until recently, those concerns have been largely dismissed by politicians and investors. In the early 2000s, as the Bush administration was discussing the budget impact of the war in Afghanistan and of upcoming tax cuts, VP Dick Cheney famously quipped that “Reagan proved deficits don’t matter”. In a way, he was “right” back then, as the debt-to-GDP ratio remained below 60% and was not cause for concern. Since the GFC, deficits have ballooned, but as interest rates dropped to record lows, the national debt was still sustainable despite being high. What has really shifted the perspective in recent years is the rise in interest rates caused by the resurgence of inflation: at nearly 1 trillion, the interest expense is now surpassing defense spending.
The first course of action to address a debt problem is to implement some form of austerity, by cutting spending or raising taxes (or both). The Trump campaign initially promised to cut 2 trillion in spending (from a 7 trillion budget, mind you), but backpedaled fairly quickly on that number. As could be predicted from the experience of Europe in the 2010s and Southeast Asia in the 1990s (where the implementation of austerity led to significant social upheaval), the DOGE’s efforts to cut spending were met with considerable resistance, leading Elon Musk to step away from DOGE last May and the whole initiative being mostly put on the back burner. Adding insult to injury, the Big Beautiful Bill increases spending in the short term, with the cuts being backloaded, which means they could be challenged by the next administration.
Since it has become apparent that austerity is too difficult to implement politically, the narrative in Washington has shifted towards growing out of the debt problem. The idea is that if the economy grows faster than the debt, the debt-to-GDP ratio will decline over time and the problem will take care of itself. This could work in the case of an export-oriented nation, which could find ways to boost its trade revenues and use them to pay back some of its debt over time. However, in the case of a consumer-oriented economy where the growth in recent years has been primarily driven by large increases in government spending, it is hard to see how it could work, given the low (most likely below 1) economic multiplier of government spending. The previous peak (which is expected to be surpassed shortly) in the debt-to-GDP ratio was reached in 1946 as a result of war time spending, but it quickly declined in the years thereafter as the US – whose manufacturing capacity was the only one left standing – experienced strong economic growth by helping rebuild the rest of the world. Some analysts have suggested that this time around AI could bring a similar economic miracle. While AI will enhance productivity, i.e. the amount of output per unit of time or of labor, it doesn’t mean that overall output will necessarily increase very much: a plausible outcome of the widespread implementation of AI is that the economy could generate a similar amount of output to what it currently does, but with far fewer people. In that scenario, the workers who lose their jobs to AI may have to be supported by some form of government provided income financed by additional borrowing, making the debt issue far worse.
In any case, given the lack of political will to address the problem via austerity measures, the Treasury has no other choice but to try to keep it together (i.e., keep finding buyers for US debt at the lowest possible cost) for as long as possible and hope for the best. Some recent measures, like the exemption of Treasuries from SLR requirements and the GENIUS Act, are meant to stimulate demand for government bonds (respectively from banks and stablecoin issuers) in a context of declining appetite from foreign investors. Besides, as long-term Treasury yields have been rising since 2021 with no sign of an imminent return to pre-COVID levels, Scott Bessent has indicated that he would follow in Janet Yellen’s footsteps (after criticizing her earlier this year) by tilting government borrowing towards short term maturities. The idea behind this shift is that while the Fed has little control over the long end of the yield curve (though it can exert some influence via quantitative easing or tightening policies), the Fed has much more control over the short end, since short-term Treasury yields tend to track policy rates pretty closely. Of course, the success of this strategy relies on the Fed playing ball, i.e. cutting rates. So far this year, Jay Powell has refrained from rate cuts despite increasing pressure from Trump, out of concern for the potential impact of the administration’s tariff policy on inflation, and despite multiple data points (including the Fed’s own beige book) showing that the economy has slowed materially in recent months. Trump’s public criticism of Jay Powell may be counterproductive, as it could be perceived as undermining the central bank’s independence (which is paramount to economic and market stability), but a broad consensus seems to be forming on the idea that rate cuts are needed to stimulate the economy. Even within the FOMC, the doves are becoming more influential, as the latest rate decision faced two dissenters for the first time in 30 years.
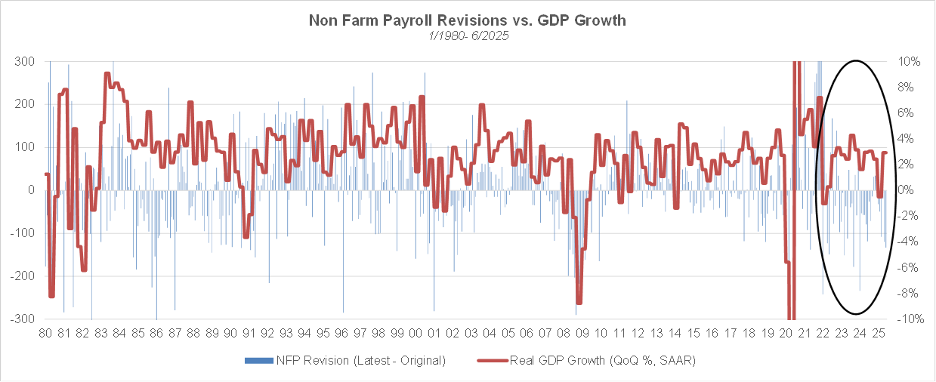
The weak recent pace of economic growth has become evident with the release of the July payroll report. Not only was the July jobs number significantly below expectations but prior months’ payrolls were also subject to meaningful downward revisions. While payroll revisions (measured as the difference between the latest payroll number for a given month and the first number available for that month) have historically been pro-cyclical, there has been a notable disconnect between the robust GDP prints since 2023 and the string of negative payroll revisions over the same period, suggesting that economic growth over the past 2.5 years was much less robust than indicated by official GDP numbers. The so-called “vibecession” mainstream narrative over the past year or so was, in fact, possibly describing an actual recession. While the abrupt dismissal of the commissioner of labor statistics may not have been the best way to address the situation and could undermine confidence in economic statistics, the latest release does reveal the need for a serious revamp in the methodologies used to quantify the labor market. For example, it doesn’t make much sense to rely on a survey of businesses (with ever declining response rates) when payroll providers like ADP and Paychex can provide a much more comprehensive view of the labor market.
Having been too late to raise rates in the face of high inflation back in 2021/2022, Jay Powell seems to be afraid of being blamed for its potential resurgence should he decide to cut rates. The specter of Arthur Burns (the 1970s Fed chair who is considered to have not done enough to fight inflation back then) looms large in the Eccles building. To his credit, there could be forces pushing inflation up in the months ahead. While tariffs are not likely to lead to a sustained inflationary impulse, they could drive inflation higher in the next few months, as some businesses pass on the tariff increases to their customers. The weak dollar could also cause imported inflation. In addition, even though the job market is weak, wage increases remain fairly robust, making it easier for companies to raise prices. However, in my view, the biggest potential driver of a rebound in inflation would be an upturn in the economic cycle. The signs of an emerging economic rebound (consumer confidence, PMIs, industrial production…) are starting to show up on economic dashboards. Note that this is not just a US phenomenon: there are signs that the global economy is picking up steam, especially in China and Europe. In addition, the latest reading of the KKT index (at 86.6%) is consistent with levels reached at the end or in the aftermath of recessions since 1956. While consensus is building that the US is entering a recession, the model suggests that on the contrary, we are getting out of one. As always at turning points, it is difficult to ascertain what could drive a resurgence in economic growth in the months ahead. Among potential factors, the weak dollar (which should favor US exports), reduced economic uncertainty from the announcement of trade deals with our top economic partners (China being the major holdout), and AI-driven capital investments are likely to be on top of the list.
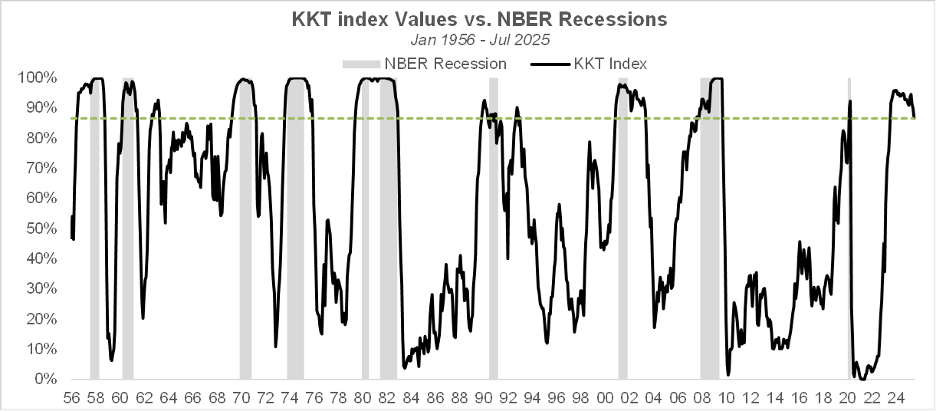
The methodology behind the KKT model is explained in the research paper below:
A NEW INDEX OF THE BUSINESS CYCLE by William Kinlaw, Mark Kritzman, and David Turkington
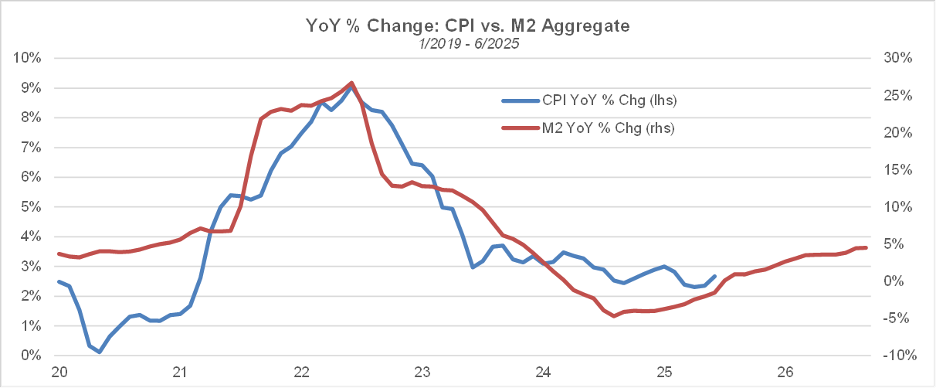
If the economy is indeed rebounding, it is likely to be accompanied by a rebound in inflation (albeit with a lag), especially if the Fed starts to ease aggressively. A potential rebound in inflation in the months ahead would be consistent with the growth rate of money supply, which rebounded in April 2023 and has been on an uptrend since. If the positive relationship between YoY CPI % and the 14-month lagged YoY growth in M2 does hold, inflation may have already bottomed out.
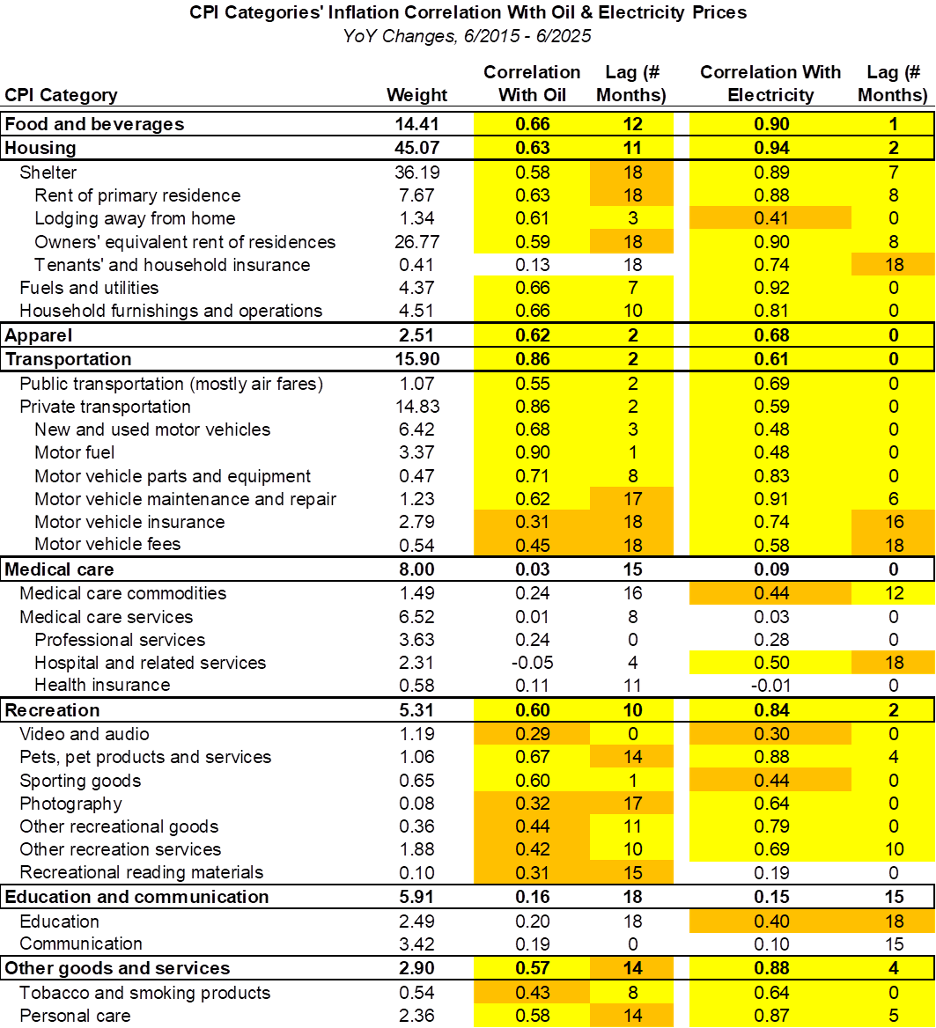
Another factor that could add further fuel to the inflation fire is the rise in demand for electricity amid the rapid buildup in AI related data centers (https://www.axios.com/2025/08/04/electricity-costs-bills-data-centers-ai), which could lead to substantial price increases. Just like oil, electricity is involved in the creation of many products and services, so a rise in its price is likely to impact many components of the CPI. As the table below shows, electricity price increases have a stronger correlation with a larger number of CPI components than oil price increases, and the impact is felt with shorter lags. In particular, the correlation with the shelter component (36% of the CPI) is much higher in the case of electricity prices (0.89 vs. 0.58), and the impact of increases is felt with a 7-month lag vs. an 18-month lag for oil price increases.
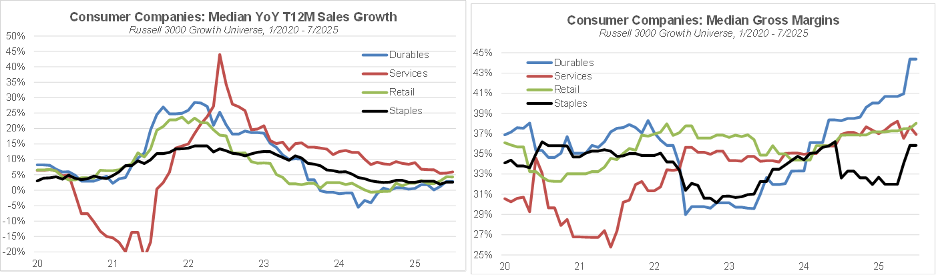
While tariffs dominated headlines last month, with many economists expecting them to fuel inflation and reduce economic growth, recently reported revenue growth and gross margins by consumer companies in the growth universe have yet to show a meaningful impact from tariffs in aggregate. The median sales growth in the 4 industries that make up the consumer sector (durables, services, retail and staples) seems to have bottomed out already, with the sector median year-over-year sales growth rate being similar to nominal GDP growth (4.8% vs. 5%). Besides, gross margins have not been negatively impacted so far.
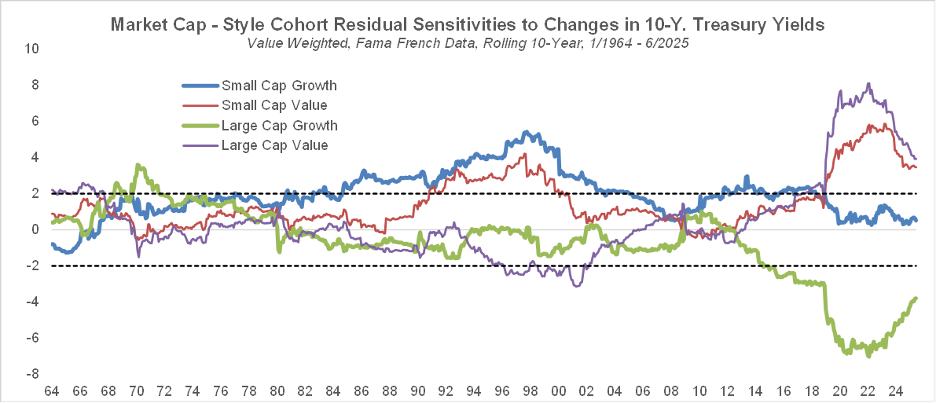
If the economy and inflation continue to rise in the months ahead, long term Treasury yields are likely to continue their upward trend as well. A popular heuristic among investors is that rising rates favor value stocks and are detrimental to growth stocks. However, a closer look at the interest rate sensitivity of the Size x Style cohorts reveals a more nuanced story. The chart below shows the results of rolling 10-year regressions of monthly returns to the value weighted large cap growth, large cap value, small cap growth and small cap value cohorts vs. monthly market returns and monthly changes in the 10-year Treasury yield, with the lines corresponding to values of the T-statistic for the coefficient associated with the change in rates variable. First, small cap growth stocks don’t currently have a statistically significant sensitivity to changes in long term rates, and the negative rate sensitivity of large cap growth stocks, while still significant, has dropped meaningfully over the past couple of years. In addition, both growth cohorts’ rate sensitivities were below the significance threshold during the 1970s, a period when long term rates were also experiencing a meaningful uptrend. Furthermore, the findings seem to be sensitive to how the growth and value cohorts are defined. This chart is based on data from the Fama French library, where growth (value) corresponds to high (low) price-to-book stocks. The results below may not hold for different definitions of the growth and value cohorts.
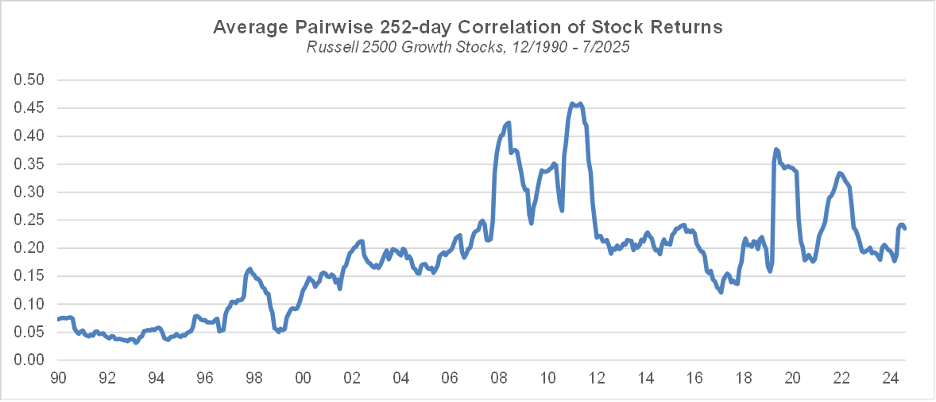
Despite the economic and geopolitical uncertainty, the equity market again continued to perform well last month. Our long-term measure of sentiment, the average pairwise correlation of stock returns remains elevated relative to history but is far from extremes.
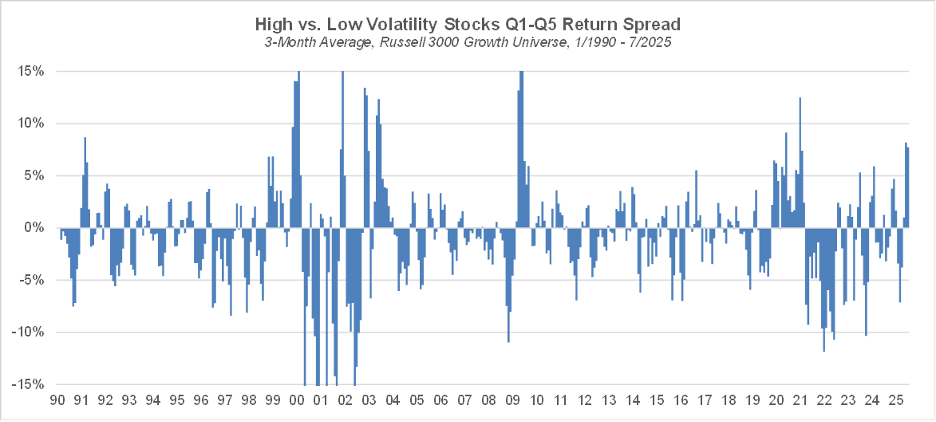
Last month saw some market action reminiscent of the 2021 meme stock craze, with some highly shorted stocks experiencing extreme, short squeeze driven returns. Another manifestation of the short-term extreme in investor sentiment is the very high relative performance of high volatility vs. low volatility stocks, which is in the 96th percentile relative to the past 35 years.
The recent market strength has brought comparisons with the height of the tech bubble 25 years ago. The AI theme is showing some signs of frothiness, with pay packages for top AI talent being comparable to those of star athletes. Meta has been aggressively attempting to poach researchers and engineers from AI competitors to staff its Superintelligence Labs. There are indications that some AI firms are making breakthroughs towards better reasoning models that go beyond the prevailing use of large language models with chain-of-thought prompting, which could explain investors’ renewed enthusiasm for AI. OpenAI has recently announced that one of its AI systems has been able to reach a gold medal worthy score on the problems of the latest International Mathematical Olympiad, a feat that seems implausible with the current generation of reasoning models.
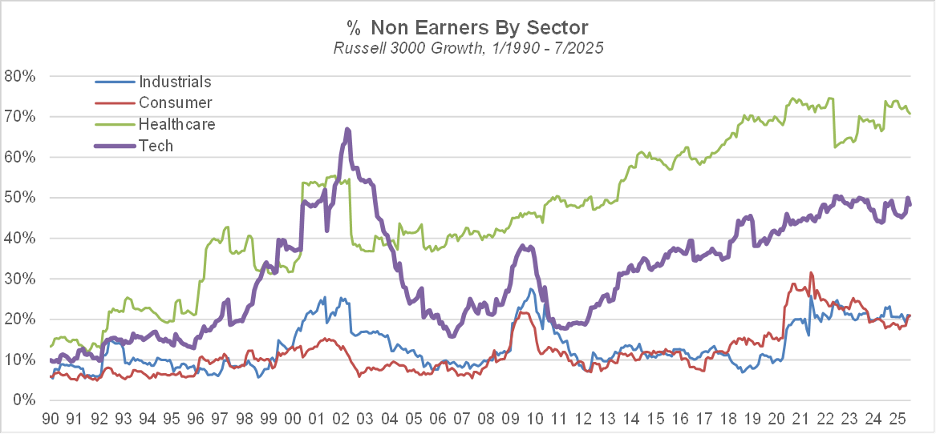
However, one significant difference with the dot com bubble is that tech companies seem to have better fundamentals now than in 1999/2000, as illustrated by a lower percentage of non-earners (defined as negative net income on a trailing 4-quarter basis). Note that such is not necessarily the case outside tech: in both healthcare and industrials, the percentage of non-earners is higher now than 25 years ago.
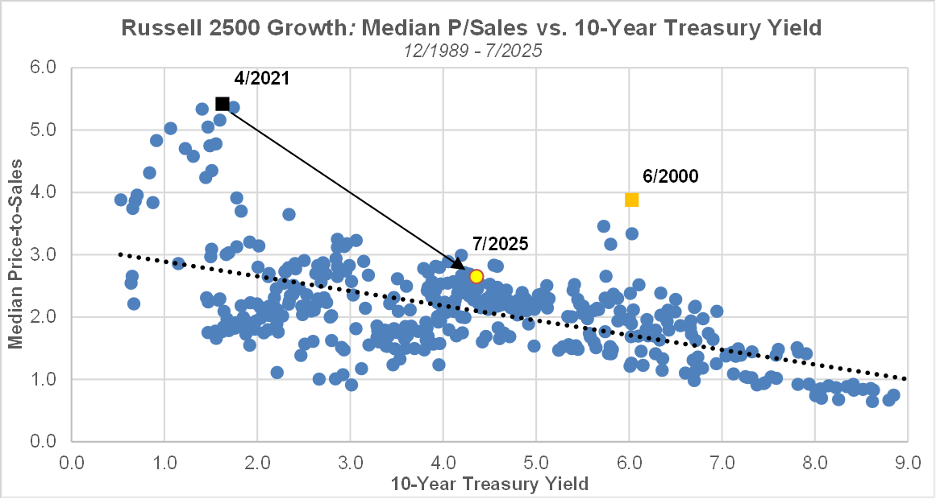
Valuations in the small & mid cap growth space remain elevated but are still at a level that is broadly consistent with the 10-year Treasury yield.
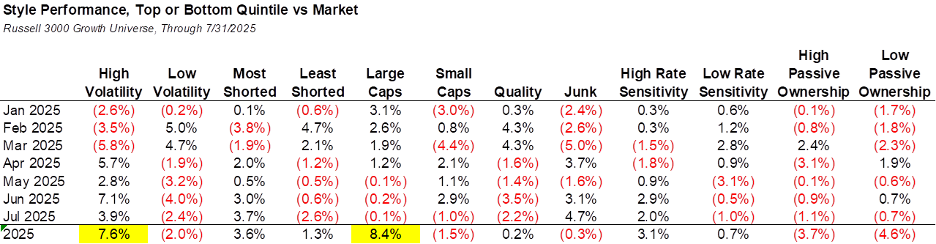
Regarding styles, large caps are still the best performing cohort year-to-date but closely followed by high volatility. Last month saw yet another strong out-performance by high volatility stocks, while low volatility stocks have continued to under-perform meaningfully.
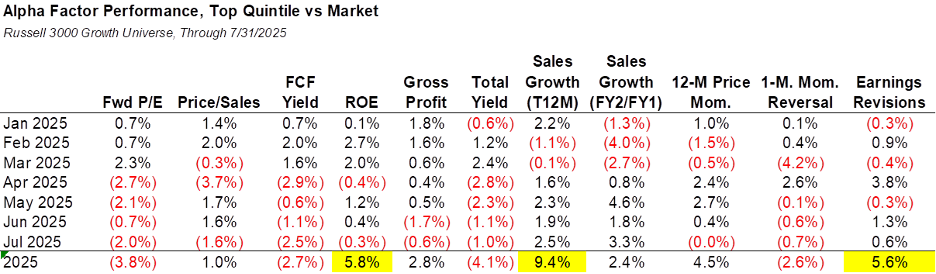
Within the factor space, top ranked stocks in terms of sales growth and earnings revisions have outperformed last month. Year-to-date, high ROE, trailing sales growth and earnings revisions stocks have fared best.
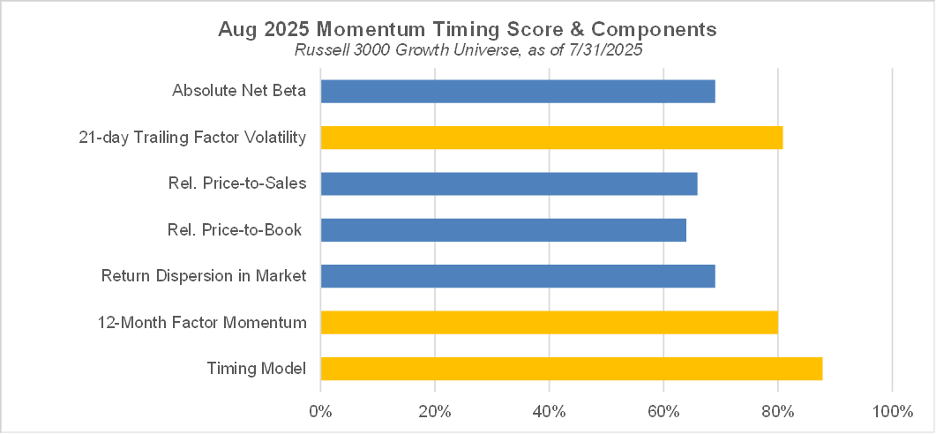
Our momentum timing model indicates that high momentum stocks have a high probability of under-performing in August. That indication is driven by the high recent volatility of the momentum factor, along with the strong performance of the factor over the past 12 months.