“Life punishes those who come too late”
— Michail Gorbachev, October 1989
The human realm is filled with adverse conditions – like chronic diseases or (within the economic domain) high indebtedness, or high inflation – that slowly build up over time and can be very hard to reverse once a critical point has been reached. When such conditions develop, humans should use their power of agency to act before reaching such critical points. If you change your diet or quit smoking early enough, you may be able to avoid type 2 diabetes or lung cancer, but experience shows that in many cases people fail to make the necessary changes before it’s too late, despite being aware of the consequences of not taking action. Similarly, policymakers across latitudes and throughout history often fail to reform dysfunctional political institutions or economic systems, despite being aware of the potential consequences. The quote above refers to a comment made by Michail Gorbachev to the leader of the former German Democratic Republic, as he expressed his conviction that East Germany – and the Soviet Union more generally – needed to embrace reforms in the face of deteriorating economic conditions and public trust in the regime. Unfortunately, the push for reforms came way too late (and was met with too much internal resistance) and the Soviet Union collapsed shortly thereafter.
Because of the Fed’s past decisions – or lack thereof – the trajectory of US inflation may be out of the Fed’s hands, as we have moved to a macro regime characterized by fiscal dominance, i.e., by fiscal policy being the main driver of key economic variables. After Paul Volcker was finally able to bring inflation under control, the Fed under Greenspan and his successors has gotten involved in boom/bust market cycles of ever-increasing magnitude, where each bust brings about more aggressive easing, which ends up blowing an even bigger bubble. As a result, from the 1990s to 2020, Fed funds rates have trended down to the zero bound and the size of the Fed’s balance sheet has ballooned because of asset purchase programs that started in large amounts under Bernanke. When the COVID pandemic broke out, Jay Powell pulled out all the stops in terms of monetary easing under the guise of “exigent” circumstances, not only bringing rates to zero but also implementing asset purchase programs that dwarfed what Bernanke did in terms of size and scope. While easing monetary policy was certainly necessary, did the Fed really have to buy junk bonds? Alas, while his predecessors were able to get away with substantial policy easing without unleashing a subsequent bout of high inflation, Jay Powell was not so lucky: his extraordinarily easy monetary policy combined with no less extraordinary fiscal stimulus and snarled global supply chains has led to a strong surge in inflation this time around, which he misjudged as transitory. His lack of a forceful and timely response to that surge may help explain why the Fed has struggled to bring back inflation near the 2% target, as the delay in tightening monetary policy may have been long enough for inflation expectations to become unanchored in people’s minds. Starting in 2022, American workers have taken notice and started pushing for higher wages, making it more difficult to bring inflation under control. The continued loose fiscal policy certainly didn’t make the Fed’s job easier, but it would have been harder for the government to keep pursuing such policies if interest rates had been high enough. Understandably, given its excessively easy policy during COVID and failure to timely and forcefully rein in the subsequent inflation, the Fed’s insistence on keeping its independence is not well received by a president who, unlike the Fed chair, has been voted into office by and is accountable to the American people and who is on the receiving end of the public’s discontent should the economy experience a contraction or high inflation.
The KKT index, which aims to measure the relative proximity of current economic conditions to periods of strong economic growth vs. recessions, has dropped further at the end of August to 81.2%, a level that is consistent with the US economy coming out of a recession. All else being equal, a Fed rate cut of 25 bps mid-September could bring the index to 80.6% and a 50-bps cut – which is now increasingly expected by market participants following last Friday’s poor jobs report – could bring it down further to 80%. The recent deterioration in the job market has led some economists to believe that the economy is about to enter a recession, but it is worth remembering that payrolls and the unemployment rate are lagging indicators: while the 2008/09 recession ended officially in June 2009, payroll numbers were consistently negative until March 2010. In addition, job creation has been meaningfully over-estimated over the past 2 years, as evidenced by the consistent string of negative payroll revisions and comparisons between the payroll survey and the far more comprehensive and accurate quarterly census of employment and wages. As is often the case at turning points, the drivers of economic growth in the upcoming cycle may not be immediately apparent.
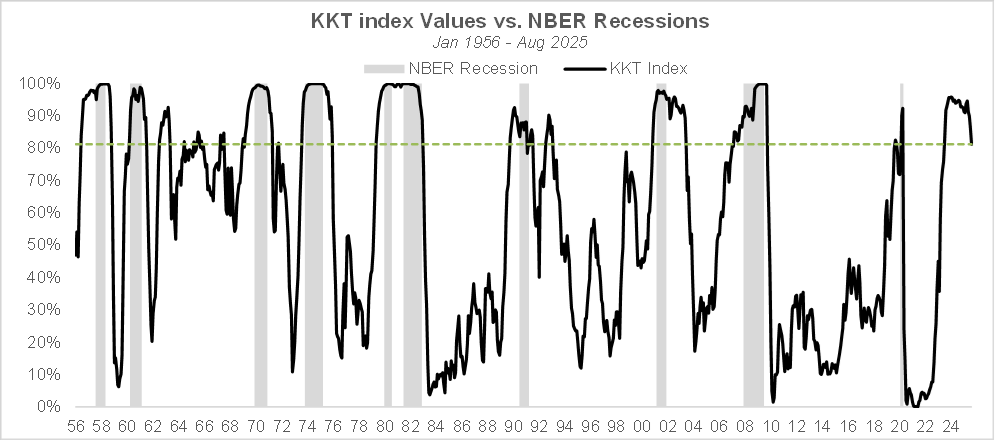
The methodology behind the KKT model is explained in the research paper below:
A NEW INDEX OF THE BUSINESS CYCLE by William Kinlaw, Mark Kritzman, and David Turkington
With the economy emerging from a recessionary/slow down period, the disinflationary trend that has been in place since the summer of 2022 – and for which the Fed takes credit – may come to an end in the next few months, as inflation is typically a lagging indicator of the economic cycle. Investors and analysts have been concerned with the potential inflationary impact of tariffs, but there are broader factors that could bring longer lasting contributions to a rise in inflation. The discussion above has already mentioned the impact of easy monetary policies and the potential anchoring of inflation expectations, but other factors include the administration’s restrictive immigration policies which shrink the supply of labor and give wage earners more bargaining power. The structurally weak dollar (resulting from foreign investors’ decreasing willingness to finance the US government’s expanding budget deficits), which may cause imported inflation and the increasingly evident splintering of global trade into two blocks, reduces American companies’ access to sources of cheaper foreign labor.
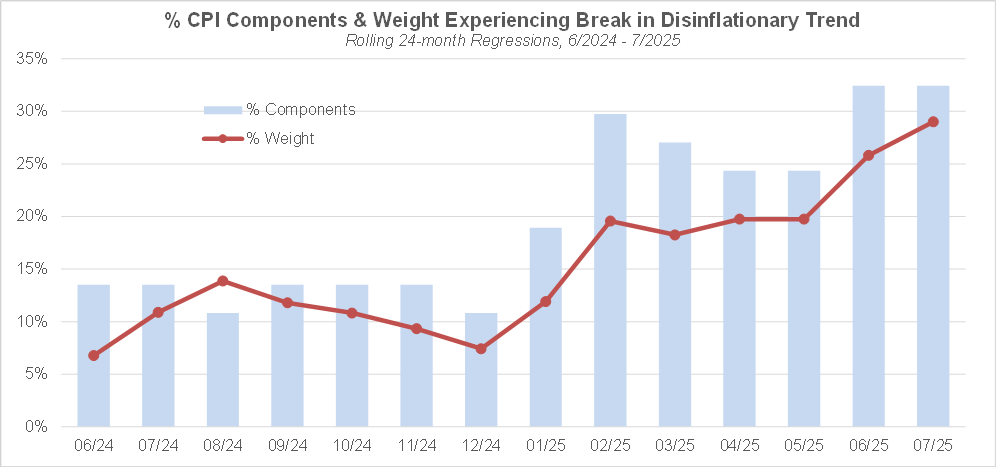
While overall consumer inflation has not yet clearly inflected upward, the breadth of CPI components that have experienced an upward inflection has been on an upward trend since the middle of last year. In a recent NBER working paper entitled “Turning points in inflation: a structural breaks approach with micro data” (http://www.nber.org/papers/w34102 ), Alberto Cavallo and Gaston Garcia Zavaleta introduce a new methodology for identifying break points in inflation that combines high frequency (daily) price data with structural breaks estimation techniques, in order to provide more timely indications of shifts in inflation trends. In particular, they measure inflation trends using the slope of the log price index (as opposed to the conventional percentage changes in inflation indices), since doing so helps mitigate noise and base effects and doesn’t require specifying a measurement window. In addition, the search for structural breaks at the component level may help identify trends that may not yet be visible in the overall price index. Their analysis finds evidence of a turning point in US inflation in February 2025 with several sectoral accelerations despite a stable overall inflation rate.
Since the paper shows that the authors’ analysis remains relevant when using the monthly frequency CPI component indices generated by the BLS instead of daily price index data, I have made a similar attempt at identifying structural breaks in inflation, based on decomposing the overall CPI into 37 components and on running rolling regressions with expanding windows, starting in June 2022 (which marked the peak in YoY CPI inflation) and ending in each month from June 2024 to July 2025. As shown below, the percentage of components experiencing an upward break in their inflation trend has jumped in February 2025, with 32% of CPI components that have experienced a statistically significant upward inflection as of 7/2025 vs. only 13% as of 6/2024. Over the same timeframe, the aggregate weight of the components that have experienced such an inflection has steadily risen from 7% to 29%. While only a minority of the components and weights are experiencing accelerating inflation and the biggest components related to shelter have not experienced such a structural break so far, this developing trend should have policymakers concerned about a potential resurgence of inflation. While the market seems to be celebrating the current dampening of economic uncertainty and upcoming Fed policy easing, it may start getting concerned in the first half of next year if the current inflation acceleration observed in a minority of components starts to become apparent in the aggregate index.
In recent years, a significant driver of economic growth has been the wealth effect from rising asset prices, which helps explain why a rising stock market has been so important to policymakers, even if they may not always express it publicly. Since the GFC, the Fed – and especially Ben Bernanke – has argued that its asset purchase programs, by lifting asset prices, have increased household wealth and consumer confidence, thereby boosting consumer spending and GDP growth. However, a major side effect of central banks’ easy money policies over the past 15 years has been the emergence of a K-shaped economy, where a minority of top income earners and wealth holders drive an increasing share of overall consumption and GDP. A recent study by Moody’s has shown that the wealthiest 10% of households now account for almost 50% of total consumer spending (and 1/3 of GDP) vs. 36% 30 years ago.
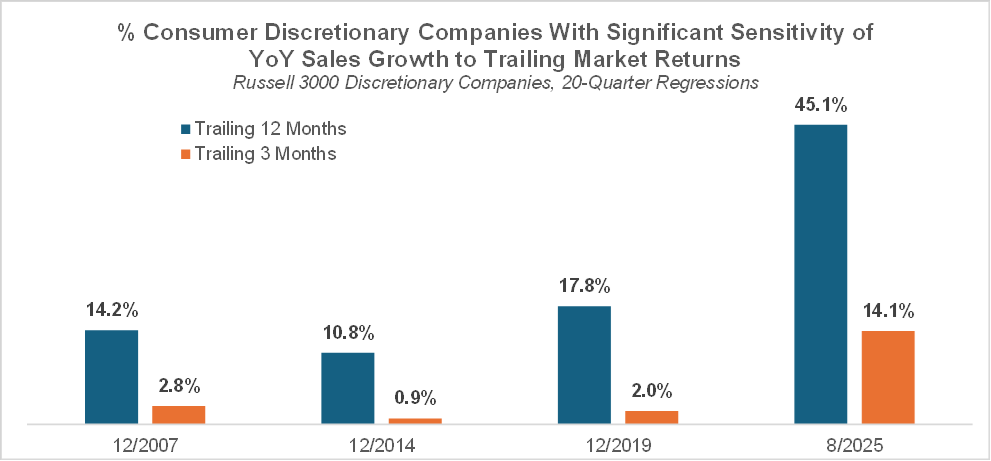
The chart below shows, for 5-year periods ending in respectively, 12/2007, 12/2014, 12/2019 and 8/2025, the percentage of consumer discretionary companies within the Russell 3000® that have exhibited a statistically significant sensitivity of YoY quarterly revenue growth vs. market performance in the 3 months and 12 months before the beginning of a given quarter. In the most recent 5-year period, the relationship between discretionary companies’ revenue growth and the stock market’s recent past performance has strengthened considerably vs. prior 5-year periods, with 45% of those companies exhibiting a significant, positive sensitivity of their YoY sales growth to the prior 12-months’ market return vs. only 10% to 20% of discretionary companies in prior 5-year periods. Even the shorter term 3-month returns now exhibit a meaningful relationship with consumer companies’ revenue growth, since 14% of such companies have a significant sales growth sensitivity to prior 3-month market returns. Note this analysis doesn’t make any claims of causality. A stock market rise may not cause a subsequent increase in the sales of consumer discretionary companies: a more plausible explanation for the positive relationship is that the market correctly anticipates consumers companies’ future sales growth. However, the strengthening of the relationship in recent years would be consistent with an increasing prevalence of the wealth effect.
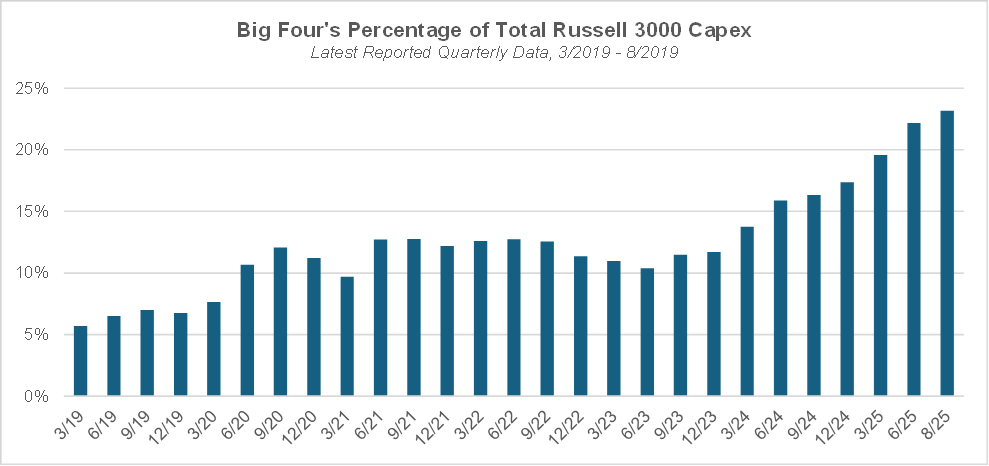
Since the release of ChatGPT in late 2022, the AI theme has been a key driver of equity returns, but it is also becoming an important contributor to economic growth, to the point where investments in AI are now noticeable in GDP statistics. AI-related capital expenditures also represent a substantial portion of the private sector’s total. The chart below shows that capex by four companies that invest massively in AI (Meta, Google, Microsoft, and Amazon) represents ~23% of aggregate capex by Russell 3000® companies, vs. 12-13% before ChatGPT put AI into the spotlight. AI may become an important part of the upcoming economic expansion, as its impact on future activity will likely go way beyond the building of new data centers and may include for example the creation of new electricity generation capacity (to power those AI data centers) or the building of AI-controlled smart factories in order to accommodate the push for reshoring manufacturing.
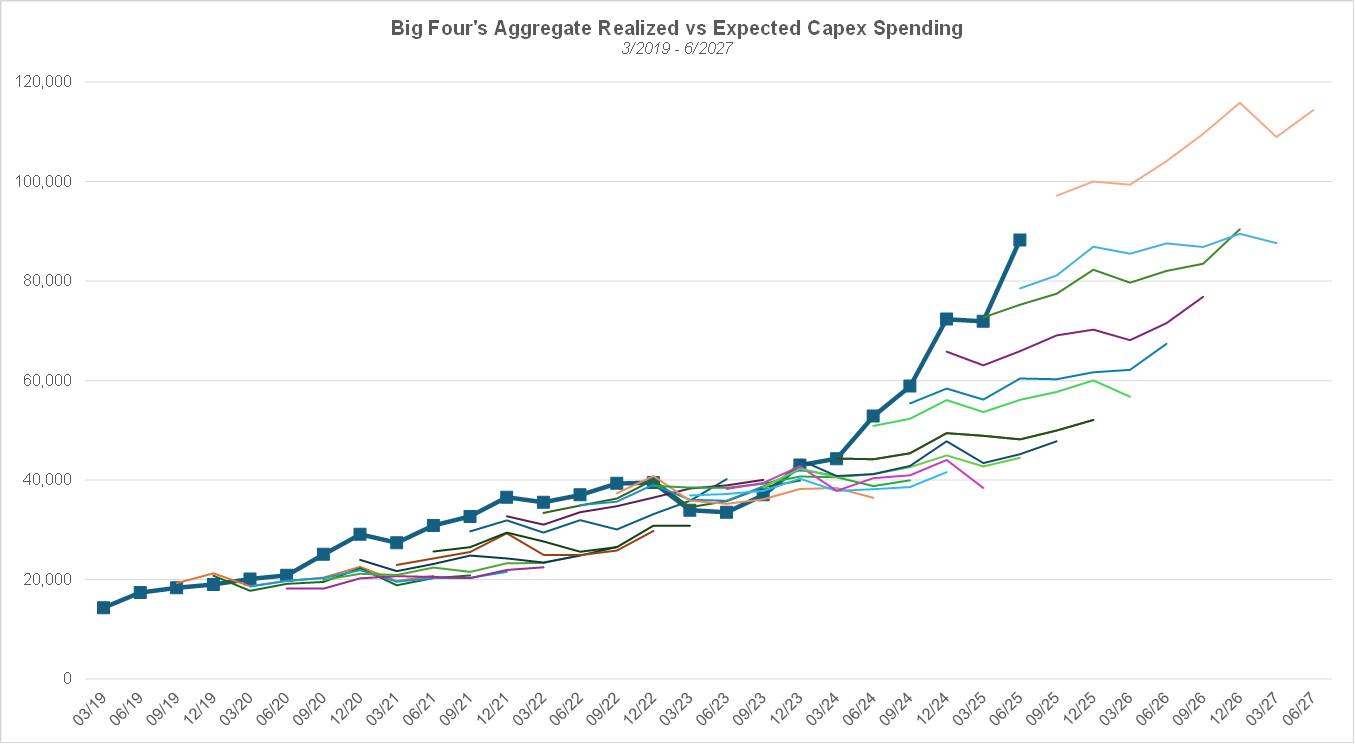
While it may seem that AI-related capex spending has expanded at a breakneck pace, realized spending has exceeded expectations so far. The chart below shows, for each quarter from Q1 2019 to Q2 2025, the aggregate amount of capital expenditures vs. expectations for that quarter and the 7 quarters thereafter (as of the end of the previous quarter) for the four companies mentioned above. Aggregate capex has been on an accelerating trend since the middle of 2023 and has exceeded expectations in recent quarters. Growth expectations (the slopes of the lines plotting future quarters’ expectations) have risen somewhat since the middle of 2023 but are not close to matching the realized growth rate, indicating that analysts are being conservative in their forecasts of future spending on AI, an attitude which is inconsistent with the AI theme being in a bubble.
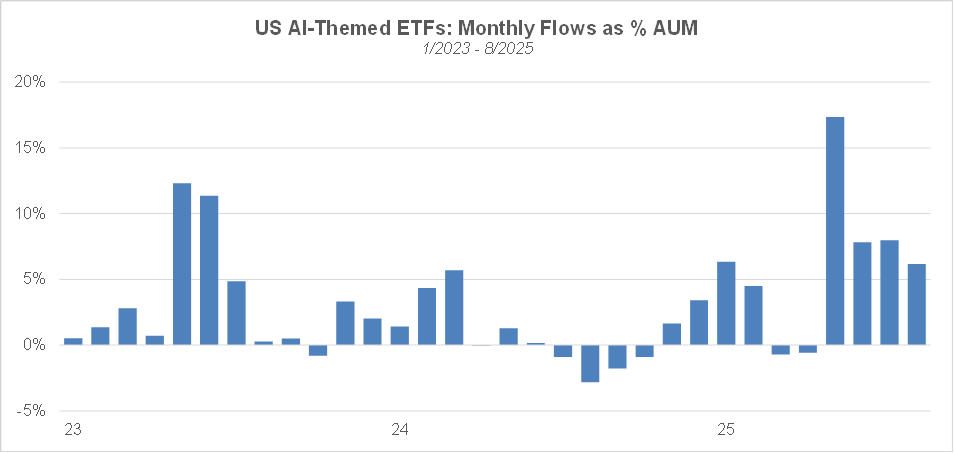
After modest outflows in March and April, AI ETFs have experienced strong inflows in the past four months, highlighting the positive investor sentiment towards the theme. The pace of creation of new AI themed ETFs has also been fairly robust: 3 in 2023, 9 in 2024 and 8 so far this year.
While there is no commonly accepted definition of “AI stocks”, it is possible to create an AI universe by aggregating the holdings (and assets) of AI themed ETFs. Focusing on the 15 AI-themed ETFs in FactSet’s database that have launched before the end of June 2023 and selecting only the constituents that are part of the Russell 3000® Growth leads to a universe of ~130 “AI stocks”. The table below shows the top 21 constituents, where the weights are value based. The 21 names represent ~2/3 of the total weight, highlighting the extent to which the AI universe is concentrated.
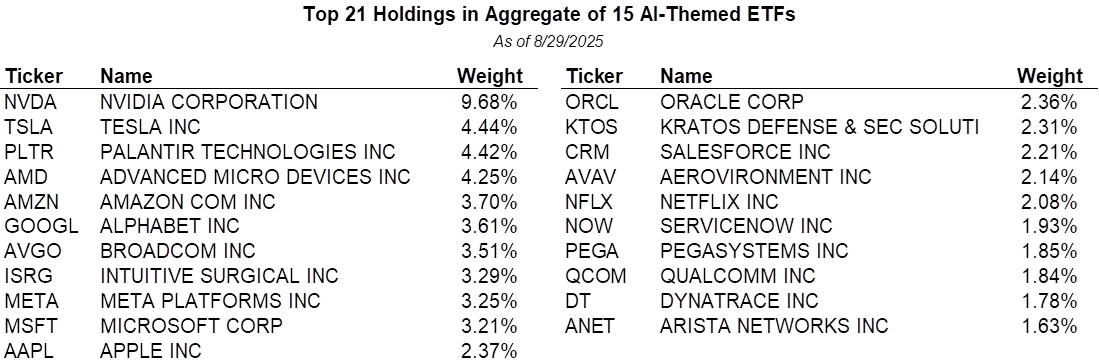
Source: FactSet, SIMG Analysis
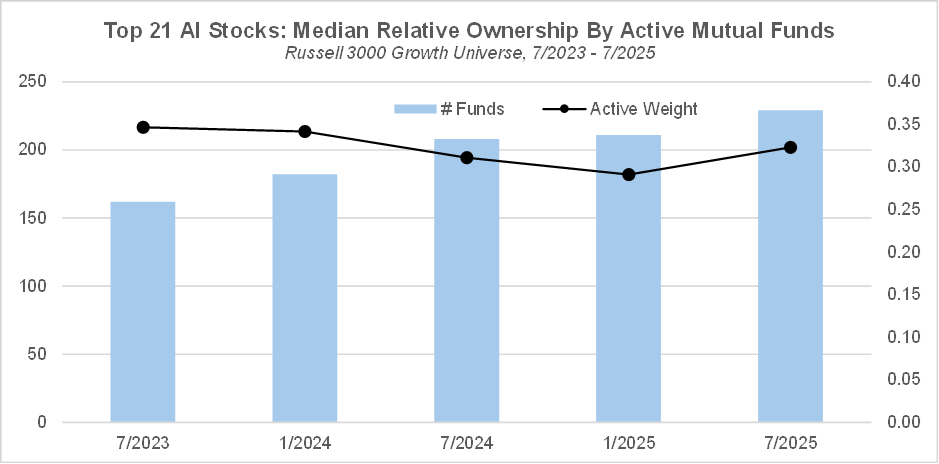
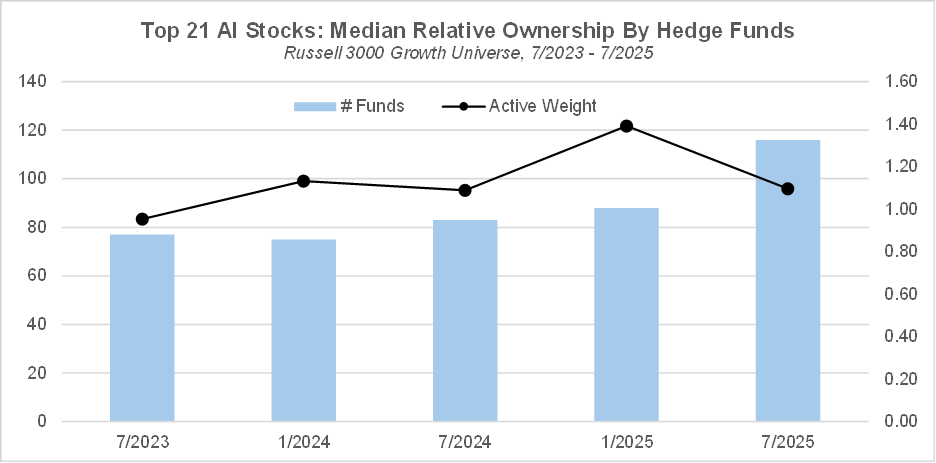
Those 21 AI-related names have become increasingly popular among institutional investors over the past two years, raising concerns that they could become crowded. The median relative (to the Russell 3000® Growth universe) number of active growth-oriented equity mutual funds (i.e. categorized by Lipper as either large cap growth, mid cap growth or small cap growth) for this group of 21 stocks has been steadily rising from ~160 as of July 2023 to ~ 230 as of July 2025, even though the median relative active weight has been fairly stable. Similarly, the median relative hedge fund ownership for those stocks has risen from ~80 to ~120 in the past couple of years.
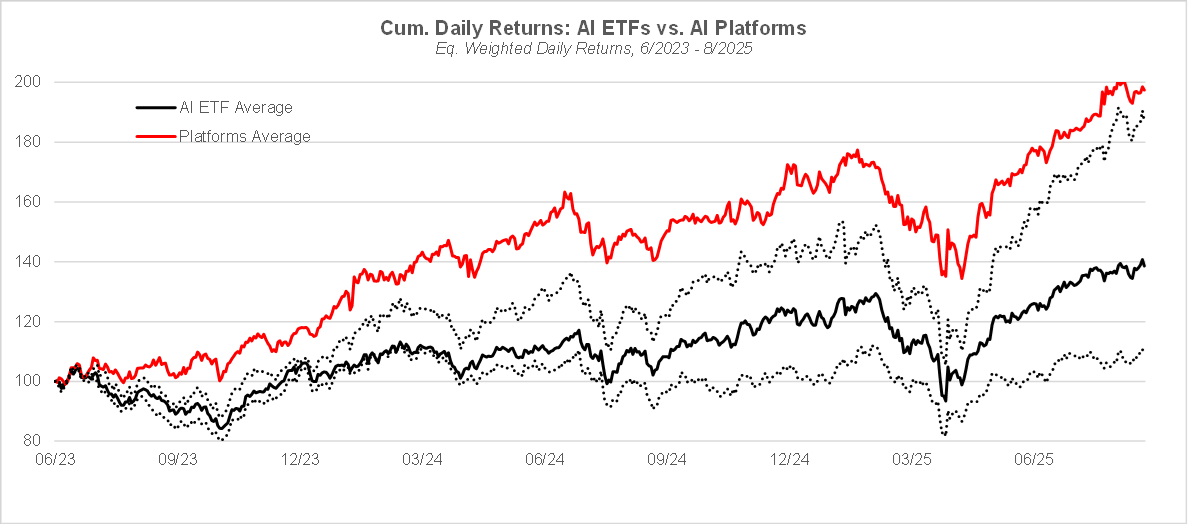
In addition, the market seems to have rewarded the major AI platforms (Microsoft, Meta, Google) far more than the other companies in the AI universe. Since June 2023, the cumulative average return to the three platforms has far exceeded the average of the 15 AI-themed ETFs. In prior notes, I have mentioned how the platforms have substantially outperformed other sub-themes within AI, and in particular the companies outside the tech sector that are poised to benefit from the implementation of AI. As a result, I expected some rotation away from the former and towards the latter. However, no such rotation seems to have happened so far. My hypothesis in that regard is that investors are still hooked on the narrative of reaching AGI (Artificial General Intelligence) within a few years, which draws their attention (and investment flows) towards the platforms, at the expense of companies with less grandiose, more concrete goals. The idea that AI would reach and even surpass human intelligence has been heavily promoted by the AI community. The influential leaders of AI platforms (Sam Altman, Elon Musk, Mark Zuckerberg, Dario Amodei) have all predicted that AGI would be reached in a short timeframe (2025 to 2027). The push towards AGI permeates OpenAI’s corporate culture. Former OpenAI employees Ilya Sutskever and Mira Murati have named their respective ventures “Safe Superintelligence” and “Thinking Machines.” Some AI researchers have recently been able to get compensation packages on par with those of star soccer players. However, there are signs that AI is not yet ready to replace humans. GPT-5 was received unfavorably by the public, leading OpenAI to bring back the previous generation of models just 24 hours after the release. Sam Altman himself is now starting to pivot, saying that AGI is “not a super useful term.” Many users of AI have already had negative experiences – hallucinations, sycophantic behavior, memory loss, insubordination – leading them to question its reliability, and a recent MIT study has shown that a large majority of corporate AI projects don’t lead to productivity gains. Even in code generation – one of the most promising applications of current AI systems – senior developers are complaining that the code generated by AI may be inefficient and not mesh well with existing code, leading to hours of reworking by human coders. Current AI techniques may have reached their limits, in which case new paradigms may be needed to move further towards human intelligence. After all, the technology has progressed with fits and starts since its inception in the early 1950s, including two AI research winters (in the late 1970s and early 1990s). Once the investment community realizes that progress has slowed, we may finally see this rotation towards companies that focus on implementing AI solutions.
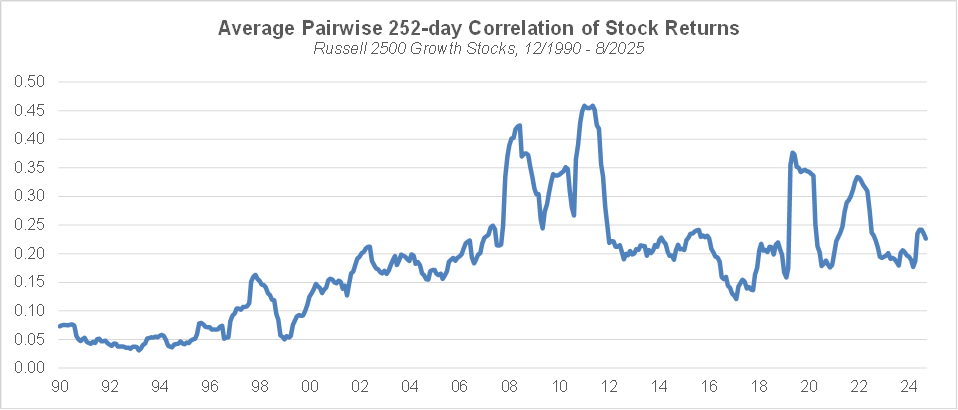
The US equity market’s uptrend that started in April has continued last month, despite the lingering macro uncertainty. The strong prevailing “risk on” sentiment has led market commentators to assert that the overall market or the AI theme are in a bubble. However, measures of sentiment are far from the levels reached during historical extremes in positive investor sentiment, like in 2019, 2007 or 1999/early 2000. For example, our long-term measure of sentiment, the average pairwise correlation of stock returns, at 0.226 is near the median of post GFC historical values, and nowhere close to the 0.158 level reached in 1/2020, much less the 0.05 low from 12/1999. In the short term though, the VIX index is at low levels (~15 as of 9/5) and September is a seasonally weak month with regard to market returns, so a market correction wouldn’t be surprising after the strong returns observed over the past four months.
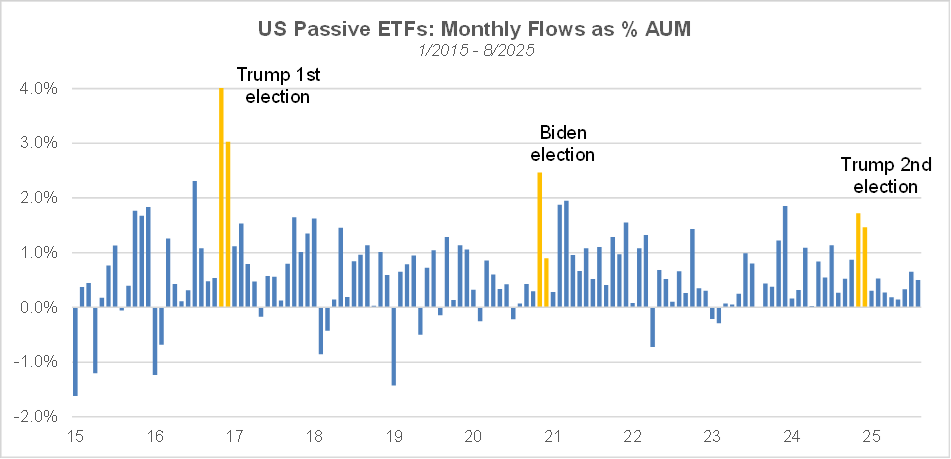
Flows into passive ETFs provide another indication regarding investor sentiment. After two months of strong inflows following Trump’s election, passive ETFs have seen more moderate inflows in subsequent months, of much more modest magnitude compared to the inflows in 2021 and 2017 (i.e., the two prior first years of a presidential cycle).
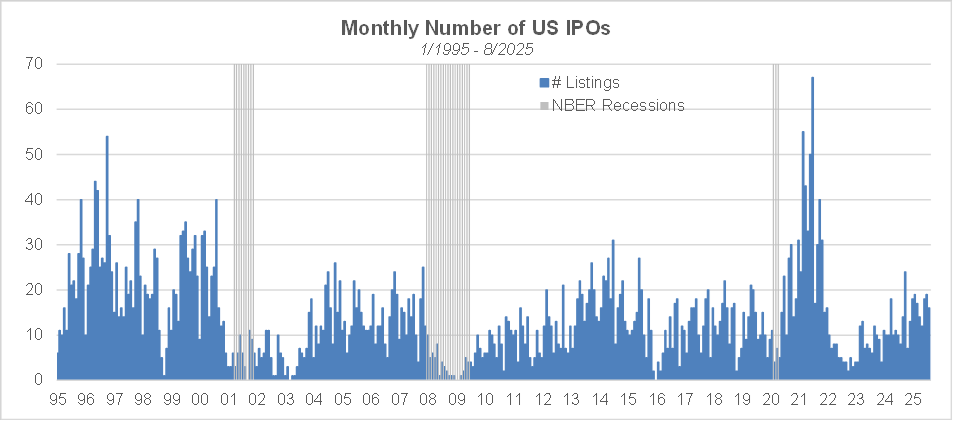
IPO activity is also positively correlated with investor sentiment. As the chart below indicates, the number of monthly IPOs in the US has been on a rising trend since early 2023 but is only roughly half what it was in late 1999 / early 2000.
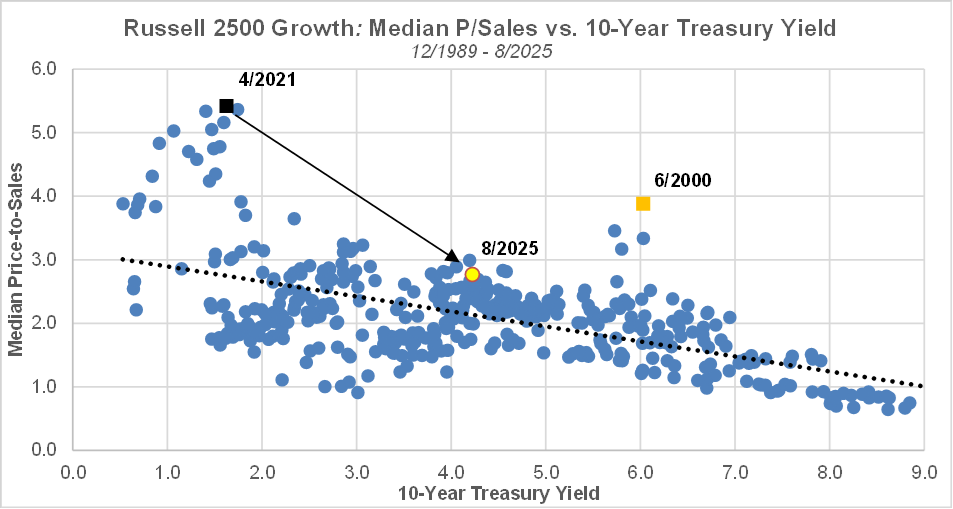
Analysts may point to aggregate market valuations being at historical extremes – according to a variety of valuation measures – to support the “bubble” argument. However, those high aggregate valuations are primarily driven by a relatively small number of large cap stocks, many of which being related to the AI theme. However, within the small & mid cap growth space, the median price-to-sales ratio indicates only moderate over-valuation considering the current level of interest rates, the magnitude of which is nowhere near the extremes reached in 6/2000 and 4/2021.
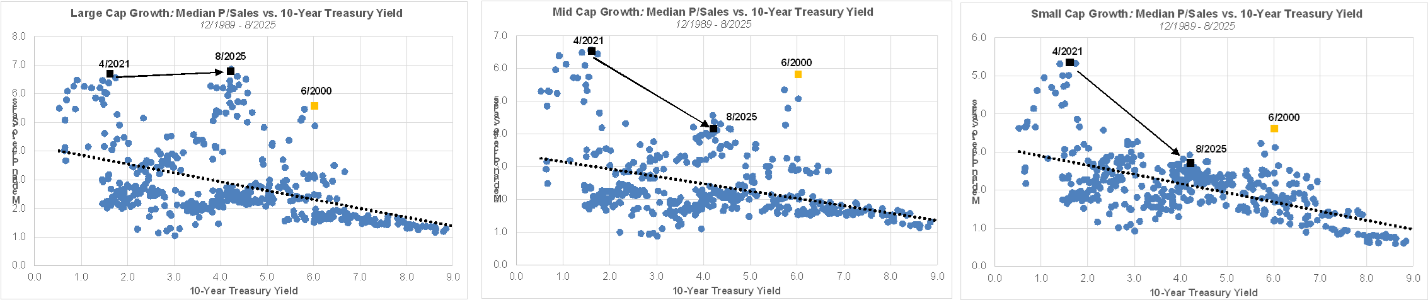
Breaking down the growth universe into large, mid and small caps reveals the extent to which the largest names have distorted overall valuations. The median price-to-sales in large cap growth stocks is at an historical extreme that is completely disconnected from the historical relationship with the 10-year Treasury yield. Mid cap growth stocks also appear significantly over-valued on that basis, but to a lesser extent than large cap growth stocks. However, small cap growth stocks do not seem overly expensive, even though their current multiple is at the higher end of the range given the current level of rates.
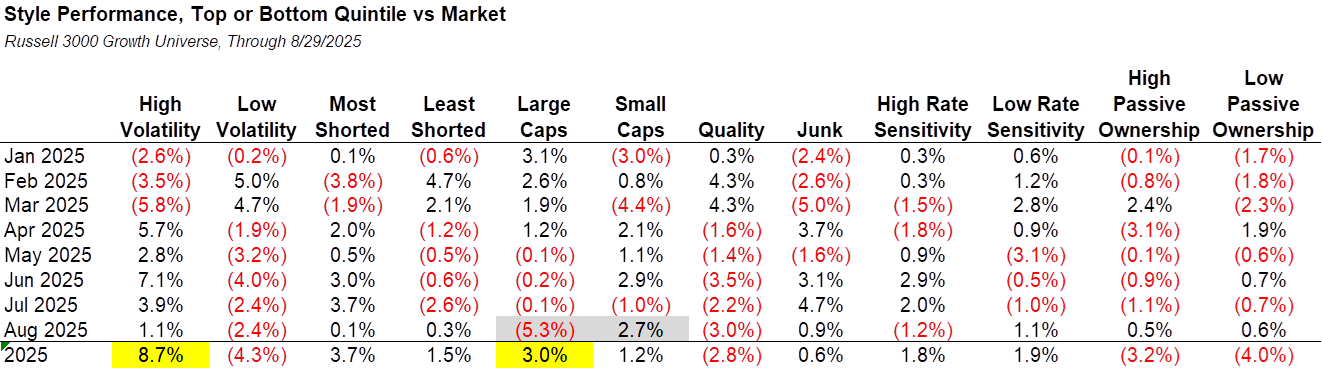
Given the strong risk-seeking investor sentiment that has prevailed since April, high volatility stocks have unsurprisingly had yet another strong month in August and have been the best performing cohort so far this year. In addition, small caps materially outperformed last month while large caps under-performed strongly, which could be a sign of an emerging style rotation. Year-to-date, high volatility followed by most shorted and large cap stocks have been the best performing styles.
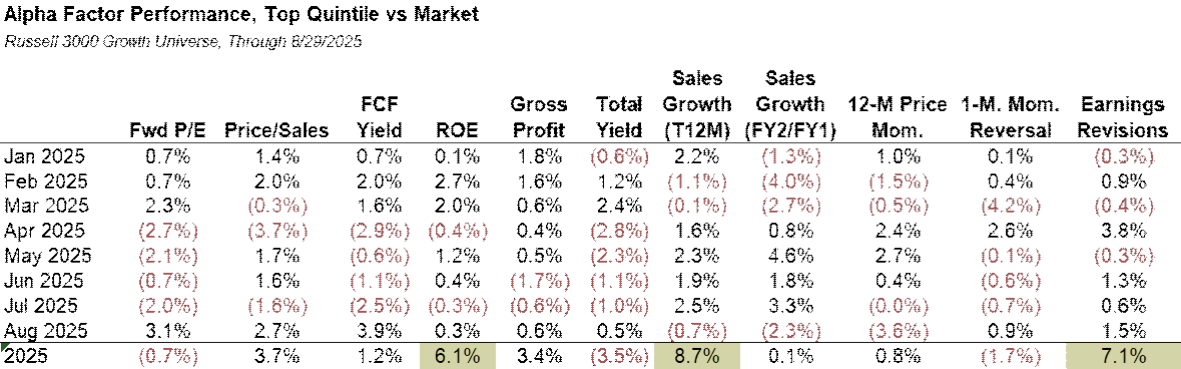
Within the factor space, the cheapest stocks in terms of forward P/E, Price/Sales and FCF yield substantially outperformed in August, while those with the highest price momentum and FY2/FY1 revenue growth expectations underperformed. However, ROE, trailing sales growth and earnings revisions remain the best performing factors (in terms of top-ranked stocks vs. market) year-to-date.
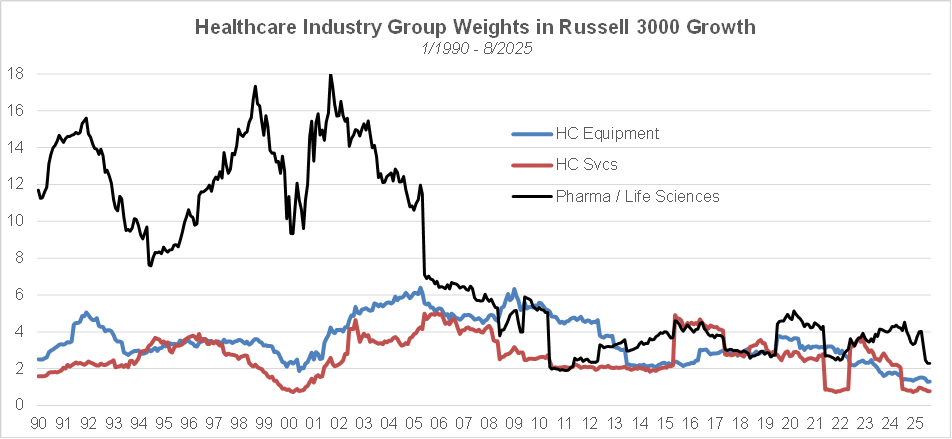
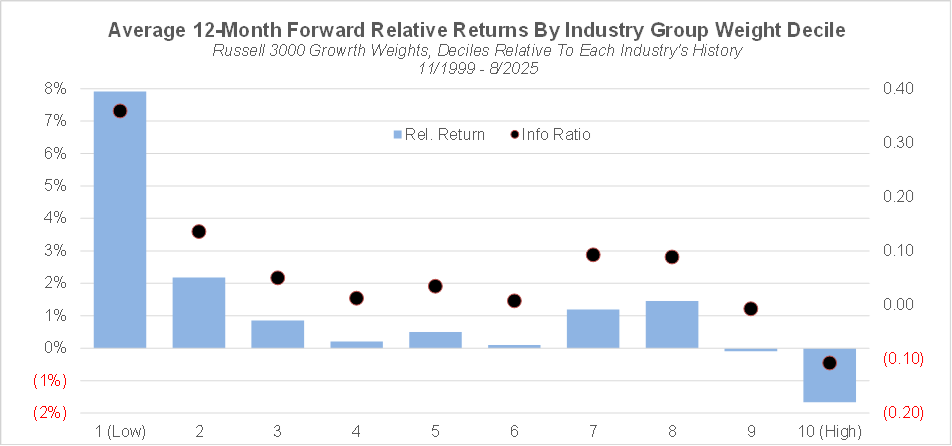
The increasing market concentration over the past few years has led to significant disparities in industry weights. Over the past month, a number of financial media outlets have noticed the historically low weight of the healthcare sector in the major equity benchmarks, with the implication that such a historically low weight would bode well for the sector’s future performance. Our analysis of industry group returns (based on members of the Russell 3000® Growth index) since 1990 provides empirical evidence of an inverse relationship between history relative industry group deciles in terms of index weight and subsequent 12-month industry group returns, but the relationship is economically significant only for extreme deciles. The chart below shows the average forward 12-month relative-to-market return and information ratio by GICS industry group decile in terms of index weight relative to the industry group’s own history, starting in 12/1989 and until the time at which the decile is determined (i.e. deciles are calculated based on expanding time windows). Industry groups that have been in the lowest decile in terms of history relative index weight have outperformed the overall market by ~8% in the subsequent 12 months. Forward 12-month outperformance for industry groups in the second decile remains meaningful, at ~2%. By contrast, industry groups with the highest history relative weights have under-performed by 1.7%.
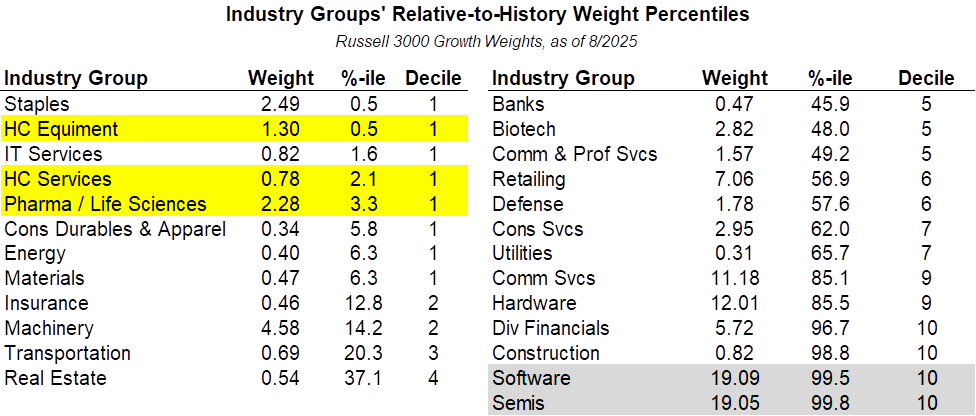
At the end of August 2025, three out of five healthcare industry groups – healthcare equipment, healthcare services and pharma/life sciences – are in the lowest decile in terms of index weight relative to each group’s own history since 12/1989. By contrast, semis and software’s current weights are extremely high relative to those industries’ weights in the past 35 years, a likely consequence of the strong returns experienced by AI-themed stocks in recent years.
The chart below shows the historical weights in the Russell 3000® Growth of the three above mentioned healthcare industry groups, highlighting how low market expectations are with regard to these groups.